
Fangqu NIU, Xinyu YANG, Xiaoping ZHANG. Application of an evaluation method of resource and environment carrying capacity in the adjustment of industrial structure in Tibet[J]. Journal of Geographical Sciences, 2020, 30(2): 319
- Journal of Geographical Sciences
- Vol. 30, Issue 2, 319 (2020)
Abstract
1 Introduction
In many developing countries, rapid economic growth and explosive population growth have led to excessive resource consumption and severe environmental pollution, which has limited or affected their regional economic development. The concept of sustainable development was developed specifically to address or avoid such predicaments (
Many concepts and methods have been developed to simulate the impact of human and natural systems coupling on sustainable development. Since China’s reform and opening up, it has made great achievements in rapid economic growth, large-scale industrialization and urbanization, but it has also paid a heavy resource and environmental costs. (
RECC evaluation methods can be summarized into two types subject to different priorities. The first one is resource supply and demand balance method. The method focuses on the ecosystem function and characterizes the absolute size of RECC by comparing resource supply and demand from the carrier and the carrying target perspective. The resource demand analysis (
The common goal of these methods is to achieve a harmonious coexistence between human and the nature. These efforts have achieved certain results in research and practice. However, there have no unified paradigms for the RECC evaluation in the current domain. Moreover, the relations between social and ecological elements need deeper interpretations, and the concept and connotation of RECC needs to be further refined. More specifically, the research on the quantitative relationship between each industry and the resource & environment is still relatively weak. To solve this issue, the detailed industrial structure analysis should be considered in the RECC research. In addition, in an open regional system, due to the problem of cross-regional occupation, there exists an ecological pressure transfer among regions, which at present has received little attention. Furthermore, the research on the characteristics of regional industrial economy remains to be strengthened.
The interaction between natural ecosystems and local socio-economic systems requires comprehensive description and analysis. This can be quantified based on the interaction process among population, industries and resource environment. This paper aims to study the RECC and regional development potential under different industrial structures from the socio-ecological sustainability perspective. In the research the Tibet Autonomous Region as an example is comprehensively studied, in combination with the goals of eco-environmental protection and economic development targets. The goals are in three-folds: (1) to develop a conceptual framework for the general RECC evaluation; (2) to evaluate the regional RECC under different industrial structures and provide a decision-making support to achieve the maximum scale of socio-economic development under the precondition of a friendly environmental effective utilization of resources; (3) to evaluate the framework by applying it to a specific case study based on Tibet.
2 Study area and datasets
2.1 Overview of the study area
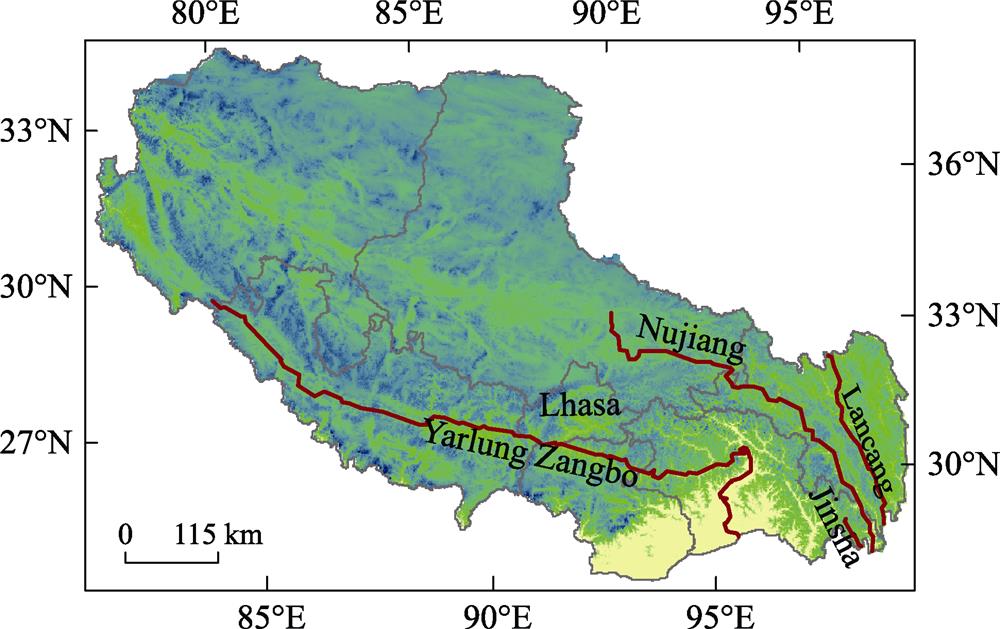
The Tibet Autonomous Region is one of the 34 provincial-level administrative regions in China. It is located in southwestern China (
![]()
Figure 1.
On the one hand, Tibet has a good ecological environment, primarily covered by forests, lakes and other natural ecological reserves. On the other hand, Tibet needs economic development and industrialization to alleviate poverty and achieve prosperity. However, the lessons learned from the imbalance between the two major factors in the eastern coastal region have made the Chinese government determined to achieve sustainable development under the constraints of local resources and the environment. The RECC can play an important role in sustainable development planning.
2.2 Datasets and parameters determination
To evaluate the RECC of an open region, it is critical to investigate and determine the socio-economic burden borne by local ecological factors, especially those that cannot be transported. On the one hand, due to the land form restrictions and ecological protection in mountainous areas, the land available for development is very scarce in Tibet (
The socio-economic data used in this study is collected from the Tibet Statistical Yearbook 2016 (
2.2.1 Water resources and consumption
In 2015, the total amount of water available in the Tibet Autonomous Region was 385.3 billion m3. The total amount of water used is 3.08 billion m3, and the total amount of remaining water resources available is 382.22 billion m3. The water consumption includes 2.72 billion m3 for agriculture, 140 million m3 for industry, 63.61 million m3 for domestic use, and 10 million m3 for ecology, etc. (
2.2.2 Water environment capacity
The water quality assessment generally involves the quantitative analysis of Chemical Oxygen Demand (COD), Biochemical Oxygen Demand (BOD), ammonia, phosphorus, heavy metals, organic acids, alkalis, etc. in water. The pollutants vary considerably with socio-economic activities (
Water Capacity (WCy) is calculated by the following equation:
where TtlWatery is the total amount of water available in year y; WS is the water quality standard, i.e., Class I and Class II water COD is ≤15 mg/L according to Environmental Quality Standards for Surface Water (
2.2.3 Available construction land
According to General Land Use Planning in Tibet Autonomous Region (2016-2020) (
3 Methods
3.1 RECC evaluation framework
To evaluate the RECC, a three-step procedure is developed in the study as shown in
![]()
Figure 2.
The industry weights are assessed by ranking the contributions of industries to the local socio-economy. Four evaluation indices of industry weights, including industrial Gross Domestic Product, Industrial Influence Coefficient, Industrial Response Coefficient and Industrial Market Potential, are established. The weight or importance of each industry is calculated as the weighted sum of the four indices. The industries with high weights have greater benefits to the local socio-economic system, so are classified as pillar industries and recommended for further development.
The analysis of the regional socio-economic impact on its resource and environment is aimed at determining the intensity of resource consumption and pollution emissions by industries and population. The industrial structure and scale are the two direct factors affecting the regional resources and environment. The resource consumption and emission intensity vary with industries, so changes in industrial structure will have an important impact on the regional resource and environment. In addition to the industries, the residents also contribute to the local resource consumption and pollution emissions.
Different development scenarios or industrial structures are developed based on the industry weights. Subsequently, the RECCs of the scenarios are calculated based on the analysis of the regional socio-economic impact on its resource and environment.
3.2 Industry weights evaluation
Here some industrial indices are used to represent the importance of industries to the regional economic development. These indices include industrial GDP, industrial influence coefficient (
3.2.1 Establishment of industrial evaluation indices
The industrial influence coefficient and response coefficient of each industry are calculated based on the Leontief inverse matrix derived from China’s Input-Output (IO)
where Ij is the influence coefficient of industry j, lij is the element of the Leontief inverse matrix at row i and column j, $\sum\limits_{i=1}^{m}l_{ij}$ indicates the economic influence of industry j on all other industries, and the denominator $\frac{1}{m}\sum\limits_{j=1}^{m}\sum\limits_{i}^{m}l_{ij}$ is the average influence.
The response coefficient is the degree to which a unit increment of the finial demand of all industries affects the demand of an industry. It is the pushing power of an industry on other industries, calculated as:
where Ri is the response coefficient of industry i, $\sum\limits_{j=1}^{m}l_{ij}$ is the response of industry i, and $\frac{1}{m}\sum\limits_{i=1}^{m}\sum\limits_{i=1}^{m}l_{ij}$ is the average response.
As shown, the influence and response coefficients of an industry are calculated based on the relationship between the development status of one industry and the average development status of the other industries, through which the impact of abnormal values in the Leontief inverse matrix on the calculation is also reduced.
The industrial market potential calculates the market advantages of an industry in a region. It takes both local and national production and market demand into account. Its relative value is calculated here as:
where Mj is the market potential of industry j, $ S_{j}^{r}$ and $ S_{j}^{c}$are the annual regional and national sales of industry j respectively while $aS_{j}^{r}$ and $aS_{j}^{c}$ are their per capita terms.
3.2.2 Industry importance evaluation and classification
To assess the importance or weight of an industry, we first determine the weight of each evaluation index. Here the information entropy method is employed. A smaller information entropy of an index indicates that there are greater differences between industries, so the index is more important and subject to a higher weight. The intuitive industry index matrix X, with m industries and four indices are listed in
| Industries | Output value | Influence coefficient | Response coefficient | Industrial potential |
|---|---|---|---|---|
| Industry 1 | ||||
| Industry 2 | ||||
| Industry 3 | ||||
| …… | … | … | … | … |
| Industry m |
Table 1.
Industrial evaluation index matrix
The matrix is first normalized based on the equation
where max(Xj) and min(Xj) are the maximum and minimum values of the index j respectively. Obviously, the normalized xij has a range between zero and one.
The entropy hj of index j is calculated as follows:
where 1/ln(m) is a normalization factor, pij is the ratio of the index j of industry i to the sum of index j of all industries,
Then, the weight Wj of index j is:
The weight Vi of industry i in the region is:
The weights form the basis for pillar industries identification and industrial restructuring. Tibet is currently in the early stage of industrialization, and economic and industrial development is still the important local needs. The Tibet industry weights are calculated in
| Class | Industry type | Weight | Rank |
|---|---|---|---|
| First Class | Non-ferrous metal mining and dressing industry | 0.617 | 1 |
| Tourism | 0.333 | 2 | |
| Wine and beverage and refined tea manufacturing industry | 0.182 | 3 | |
| Second Class | Pharmaceutical industry | 0.154 | 4 |
| Chemical raw materials and chemical products manufacturing industry | 0.137 | 5 | |
| Printing and recording media reproduction | 0.132 | 6 | |
| Paper and paper products industry | 0.127 | 7 | |
| Culture, education, arts & crafts, sports and entertainment products manufacturing industry | 0.127 | 8 | |
| Food manufacturing | 0.118 | 9 | |
| Agricultural and sideline food processing industry | 0.116 | 10 | |
| Third Class | Electric power and thermal production and supply industry | 0.078 | 11 |
| Non-metallic mineral products industry | 0.074 | 12 | |
| Ferrous metal mining and dressing industry | 0.053 | 13 | |
| Textile industry | 0.047 | 14 | |
| Wood processing and wood, bamboo, rattan, and brown grass products industry | 0.033 | 15 | |
| Electrical machinery and equipment manufacturing industry | 0.030 | 16 | |
| Non-metallic mining and dressing industry | 0.017 | 17 |
Table 2.
Industry weights in Tibet, China
3.3 Socio-economic resource consumption and pollution discharge
The analysis of the regional socio-economic impact on its resource and environment is aimed at determining the intensity of resource consumption and pollution emissions by industries and population, and subsequently used for the RECC evaluation.
3.3.1 Industry resource consumption and pollution discharge
The industrial impact on the resource and environment in the region is quantified by the industrial resource consumption intensity and environmental pollution intensity, i.e., the amount of resource consumption or pollution discharge per unit of GDP. Due to the limited data of Tibet, in this study the industrial resource consumption intensity and environmental pollution intensity are estimated based on national energy, water and land consumption (as shown in
| Class | Industry type | Water consumption | COD | Land consumption |
|---|---|---|---|---|
| m3/104 yuan of GDP | kg/104 yuan of GDP | ha/108 yuan of GDP | ||
| First Class | Non-ferrous metal mining and dressing industry | 106.5 | 4.88 | 112.63 |
| Tourism | 24.63 | 9.85 | 2.88 | |
| Wine and beverage and refined tea manufacturing industry | 79.4 | 12.09 | 33.19 | |
| Second Class | Pharmaceutical industry | 48.74 | 5.44 | 15.98 |
| Chemical raw materials and chemical products manufacturing industry | 100.8 | 6.37 | 35.83 | |
| Printing and recording media reproduction | 19.8 | 0.32 | 1.27 | |
| Paper and paper products industry | 450.33 | 90.28 | 188.41 | |
| Culture, education, arts & crafts, sports and entertainment products manufacturing industry | 20.68 | 0.22 | 1.02 | |
| Food manufacturing | 60.72 | 6.44 | 20.82 | |
| Agricultural and sideline food processing industry | 93.73 | 12.46 | 30.59 | |
| Third Class | Electric power and thermal production and supply industry | 908.46 | 0.69 | 200.00 |
| Non-metallic mineral products industry | 43.62 | 0.93 | 71.01 | |
| Ferrous metal mining and dressing industry | 93.85 | 1.14 | 16.23 | |
| Textile industry | 160.44 | 7.02 | 31.51 | |
| Wood processing and wood, bamboo, rattan, and brown grass products industry | 34.32 | 1.54 | 12.85 | |
| Electrical machinery and equipment manufacturing | 11.89 | 0.18 | 0.12 | |
| Non-metallic mining and dressing industry | 133.53 | 1.75 | 36.58 |
Table 3.
Intensities of resource consumption and pollution emission by industry
3.3.2 Residential resource consumption and pollution discharge
The development of the industry is usually accompanied by increase of population, which will also lead to the increase of resource consumption and pollution emissions. In 2015, the residential living water consumption in Tibet was 63.61 million m3, i.e., 19.63 m3 per capita.
The urbanized population and land in Tibet are mainly concentrated in its provincial capital, Lhasa, where its residential land size is 24.76 km2, the residential population is 297,100, and therefore the per capita living land is 83 m2.
In regard to water environment, the annual residential COD emission per capita (pplCODt) in year t is calculated based on equation (10).
where PopSew is the annual sewage production per capita in year t, α is the sewage discharge coefficient, and d is the COD emission concentration. The daily sewage production, emission coefficient and emission concentration of residents are obtained from “First National Pollution Sources Survey - Urban Living Sources and Discharge Coefficients” (
3.4 Regional RECC evaluations
3.4.1 Water resource carrying capacity evaluation
The water resource carrying capacity (WRCC) is the maximum population that the local water resources can support under a specific socio-economic level. At a given level, either the further developed industries, or the grown population will need to costume more resources. Here we define that the water consumption of the industry and population under the maximum load is the amount of the water available as shown by the following equations.
where Wt is the available amount of water for production and living in year t, GDPi,t is the GDP of industry i in year t, intenWi is the consumption intensity of industry i on water resource (see
In general, if more than 20% of the water in a region is used, the area is considered to be short of water (
3.4.2 Water environment carrying capacity evaluation
The water environment carrying capacity (WECC) assesses the maximum size of population supported by a given water quality. Both industries and residential populations produce pollution emissions. The sum of industrial and population pollution emissions is equal to the water environment capacity when the water environment is at maximum load.
where WECcod,t is the water environment capacity in year t, i.e., COD capacity in this study, GDPi,t is the GDP of industry i in year t, popt is the total population, intenEicod is the COD emission intensity of industry i (see
3.4.3 Land resource carrying capacity
The Land Resource Carrying Capacity (LRCC) is the number of people that can be supported by the land resources available under specific socio-economic levels. Both the industrial development and residential population demand the land resources. The sum of the industrial land and the residential land under the maximum load is equal to the total available land resources.
where La is the amount of land resources available, GDPi,t is the GDP of industry i in year t, popt is the population in year t, intenLi is the intensity of land consumption of industry i (see
4 Results
Based on the evaluation of Tibet’s industries, three industrial structure adjustment scenarios are developed. The first one is the business-as-usual scenario. We assume that the socio-economic development trend or industrial structure of Tibet remains unchanged. The second scenario is to develop the pillar industries further. The third scenario focuses on the further development of a single industry, i.e., tourism. The tourism industry is currently a vigorously developing industry with the highest output value in Tibet.
As described above, the evaluation of carrying capacity varies across different socio-economic levels which are characterized by different technical levels. The technological progress over time and its impacts on RECC is difficult to predict and quantify. This study did not include the prediction of technological progress, so for comparison between scenarios, it is assumed that they have the same technical level represented by GDP per capita, i.e. Tibet’s current GDP per capita. The evaluations of RECCs are shown in
| Carrying capacities | Business as usual | Focus on developing pillar | Focus on developing tourism | |||
|---|---|---|---|---|---|---|
| Population | Economy | Population | Economy | Population | Economy | |
| WRCC | 0.81 | 2.57 | 4.87 | 15.44 | 6.48 | 20.53 |
| WECC | 2.25 | 7.41 | 1.93 | 6.11 | 2.08 | 6.58 |
| LRCC | 0.04 | 0.12 | 0.05 | 0.17 | 0.25 | 0.79 |
Table 4.
Regional resource and environment carrying capacity evaluation
The results show that the LRCC is the weakest under every scenario, indicating that the primary factor restricting the socio-economic development of Tibet is land resources (
![]()
Figure 3.
Using
5 Conclusions and discussion
The RECC is a typical socio-ecological system focusing on the interaction between human and nature. The proposed RECC framework develops the links between socio-economic activities and resource consumption and pollution emissions. It highlights the socio-economic effects on the resource and environment, and demands the balanced development of resource utilization, environmental protection and economic development under limited resource and environment. By taking the land resource, water resource and water environment of Tibet as cases, the study reveals that: (1) the non-ferrous metal mining, tourism, liquor and refined tea industries play a pillar role in a local socio-economic system, but pillar industries focused development may reduce the local WECC; (2) the primary factor restricting its socio-economic development is land resources; (3) developing the tourism industry enhances its RECC. The proposed framework is helpful in Tibet’s actions on industrial structure adjustment and ecological protection and meanwhile pursuing economic development.
The scenarios developed in the study are not official policies. Therefore, the evaluation results can be different from the actual development. Normally, the significance of a model’s results more lies in its relative evaluation rather than the absolute values (
There are still lots of work remaining to be explored. Due to the economic scale effect and technological advancement, the resource utilization and pollutant discharge will change along with the economic development. To achieve a finer evaluation, it is necessary to identify the resource and environmental effects of the industries at different scales and technological levels. Secondly, as only land resource, water resource, and water environment are used as cases to implement the RECC framework, it is straightforward to integrate more ecological elements into the framework to extend the analysis framework. Furthermore, this study is carried out at the scale of the Tibet Autonomous Region because of the data limitation in this region. As Tibet is a large region, implementation of this framework at sub-region level is an exciting task, but a project of this kind will also have to overcome the problems of data availability.
References
[1] I Bowen. Population(1954).
[2] H J Cao. An initial study on DPSIR model. Environmental Science and Technology, 28, 110-111(2005).
[3] Jonge V N de, R Pinto, R K Turner. Integrating ecological, economic and social aspects to generate useful management information under the EU directives’ ‘ecosystem approach’. Ocean Coast Management, 68, 169-188(2012).
[4] J Fan, K Zhou, Y F Wang. Basic points and progress in technical methods of early-warning of the national resource and environmental carrying capacity (V 2016). Progress in Geography, 36, 266-276(2017).
[7] A Y Hoekstra, M M Mekonnen, A K Chapagain et al. Global monthly water scarcity: Blue water footprints versus blue water availability. PLoS ONE, 7, e32688(2012).
[8] J Kitzes, M Wackernagel, J Loh et al. Shrink and share: Humanity’s present and future ecological footprint. Philosophical Transactions of the Royal Society B, 363, 467-475(2008).
[9] W W Leontief. Structure of American Economy, 1919-1929, 181(1941).
[10] . Lhasa Statistics Yearbook(2016).
[11] T X Li, Q Fu, S M Peng. Evaluation of water and soil resources carrying capacity based on DPSIR frame work. Journal of Northeast Agricultural University, 43, 128-134(2012).
[12] W D Liu, Z P Tang, M Y Han. The 2012 China Multi-regional Input-output Table of 31 Provincial Units(2018).
[13] S Lockie, S Rockloff, D Helbers et al. A conceptual framework for selecting and testing potential social and community health indicators linked to changes in coastal resource management or condition. Coastal CRC Discussion Paper(2005).
[14] B Lou, Y H Qiu, S Ulgiati. Energy-based indicators of regional environmental sustainability: A case study in Shanwei, Guangdong, China. Ecological Indicators, 57, 514-524(2015).
[15] T R Malthus. An Essay on the Principle of Population [1st ed. of 1798]. London: Pickering(2001).
[16] H Y Mao, D L Yu. Regional carrying capacity in Bohai Rim. Acta Geographica Sinica, 56, 363-371(2001).
[19] . China Energy Statistical Yearbook 2016(2016).
[20] . China Statistical Yearbook 2016(2016).
[21] . China Statistical Yearbook on Environment 2016(2016).
[22] F Q Niu, Z M Feng, H Liu. Evaluating methods of regional resources and environment carrying capacity: A review. Resources Science, 40, 655-663(2018).
[23] F Q Niu, J Li. Modeling the population and industry distribution impacts of urban land use policies in Beijing. Land Use Policy, 70, 347-359(2018).
[24] H T Odum. Self-organization, transformity, and information. Science, 242, 1132-1139(1988).
[25] J Peng, Y Y Du, Y X Liu et al. How to assess urban development potential in mountain areas? An approach of ecological carrying capacity in the view of coupled human and natural systems. Ecological Indicators, 60, 1017-1030(2016).
[26] M V Peter, R E Paul, H E Anne et al. Human appropriation of the products of photosynthesis. BioScience, 36, 368-373(1986).
[27] W E Rees. Ecological footprints and appropriated carrying capacity: What urban economics leaves out. Environment and Urbanization, 4, 121-130(1992).
[28] I Seidl, C A Tisdell,. Carrying capacity reconsidered: From Malthus’ population theory to cultural carrying capacity. Ecological Economics, 31, 395-408(1999).
[29] P C Sutton, S J Anderson, B T Tuttle et al. The real wealth of nations: Mapping and monetizing the human ecological footprint. Ecological Indicators, 16, 11-22(2012).
[30] J Thebault, T S Schraga, J E Cloern et al. Primary production and carrying capacity of former salt ponds after reconnection to San Francisco Bay. Wetlands, 28, 841-851(2008).
[31] . Tibet Statistics Yearbook(2016).
[32] P M Vitousek, P R Ehrlich, A H Ehrlich et al. Human appropriation of the products of photosynthesis. BioScience, 36, 368-373(1986).
[33] M Wackernagel, B Rees. Our Ecological Footprint: Reducing Human Impact on the Earth. New Society Publishers(1996).
[34] Y Wada, L P H van Beek, D Viviroli et al. Global monthly water stress: Water demand and severity of water stress. Water Resource Research, 47, W07518(2011).
[35] L Wang, H Liu. Comprehensive evaluation of regional resources and environmental carrying capacity using a PS-DR-DP theoretical model. Journal of Geographical Sciences, 29, 363-376(2019).
[36] S Wang, B Fu, H Chen et al. Regional development boundary of China’s Loess Plateau: Water limit and land shortage. Land Use Policy, 74, 130-136(2018).
[37] S Wang, L Xu, F L Yang et al. Assessment of water ecological carrying capacity under the two policies in Tieling City on the basis of the integrated system dynamics model. Sci. Total Environ, 472, 1070-1081(2014).
[38] W Y Wang, W H Zeng. Optimizing the regional industrial structure based on the environmental carrying capacity: An inexact fuzzy multi-objective programming model. Sustainability, 5, 5391-5415(2013).
[39] C Wei, Z Y Guo, J P Wu et al. Constructing an assessment indices system to analyze integrated regional carrying capacity in the coastal zones: A case in Nantong. Ocean Coast. Manag., 93, 51-59(2014).
[40] D F Zheng, Y Zhang, Z Zang et al. Empirical research on carrying capacity of human settlement system in Dalian City, Liaoning Province, China. Chinese Geographical Science, 25, 237-249(2015).
[41] X Y Zhou, K Lei, W Meng et al. Industrial structural upgrading and spatial optimization based on water environment carrying capacity. J. Clean. Prod, 165, 1462-1472(2017).

Set citation alerts for the article
Please enter your email address
© Copyright 2018-2021 | Chinese Laser Press. All Rights Reserved 沪ICP备15018463号-20