Abstract
Miniaturized light sources at telecommunication wavelengths are essential components for on-chip optical communication systems. Here, we report the growth and fabrication of highly uniform p-i-n core-shell InGaAs/InP single quantum well (QW) nanowire array light emitting diodes (LEDs) with multi-wavelength and high-speed operations. Two-dimensional cathodoluminescence mapping reveals that axial and radial QWs in the nanowire structure contribute to strong emission at the wavelength of ~1.35 and ~1.55 μm, respectively, ideal for low-loss optical communications. As a result of simultaneous contributions from both axial and radial QWs, broadband electroluminescence emission with a linewidth of 286 nm is achieved with a peak power of ~17 μW. A large spectral blueshift is observed with the increase of applied bias, which is ascribed to the band-filling effect based on device simulation, and enables voltage tunable multi-wavelength operation at the telecommunication wavelength range. Multi-wavelength operation is also achieved by fabricating nanowire array LEDs with different pitch sizes on the same substrate, leading to QW formation with different emission wavelengths. Furthermore, high-speed GHz-level modulation and small pixel size LED are demonstrated, showing the promise for ultrafast operation and ultracompact integration. The voltage and pitch size controlled multi-wavelength high-speed nanowire array LED presents a compact and efficient scheme for developing high-performance nanoscale light sources for future optical communication applications.Introduction
The rise of LEDs has enabled significant advances in optical indicators, solid-state lighting, and digital displays due to high luminous efficacy, power efficiency, and long lifespan1. Reducing the device size to micro-scale and nanoscale could further improve the light emitting and extraction efficiency2, which opens up new avenues for next-generation high-resolution displays and miniaturized light sources. Compared with organic LED and liquid crystal technologies, micro-LEDs have emerged as attractive alternatives for transparent and high-luminance displays3 due to the improved wall-plug efficiency and brightness. Recently, electrically pumped GaN/InGaN nanowire array laser4 and high-speed LEDs5, 6 have been demonstrated at a visible wavelength range, which could potentially realize a high-data rate (Gb/s) for visible light communication7. However, most of the developments on micro-LEDs are based on III-nitride material systems at visible wavelengths; there have been very limited reports on high-speed infrared micro-LEDs at telecommunication wavelengths, which are indispensable for the future development of Li-Fi technology, photonic integrated circuits (PICs), and biological applications8, 9.
Selective area grown In(Ga)As(P)/InP nanowires hold great potential for miniaturized LEDs and lasers at telecommunication wavelength range, as the wide bandgap tunability of the InGaAsP material system enables monolithic integration of a multi-wavelength light source on a single chip with a single epitaxial growth, which could boost the data transmission capacity by wavelength division multiplexing (WDM) and multiple-input multiple-output (MIMO) technologies10. Also, quantum wells (QWs) are usually incorporated into the device structure to enhance the radiative recombination rate with improved quantum efficiency. Beneficial from the unique three-dimensional geometry of nanowires, QWs formed on various crystallographic facets can have different structural properties, which provides extra freedom in spectrum control for multi-wavelength operation even within a single nanowire array LED. Furthermore, the spontaneous emission rate of nanowire LEDs can be boosted by the Purcell effect due to the small footprint and be much larger than that of planar counterparts, which leads to high-speed operation with high energy efficiency and output power for ultrafast communications11.
Previously, single nanowire LEDs based on InAs/InP12 axial QW and InGaAs13 core-shell structures have been demonstrated at the wavelength of ~1.1 and 1.3–1.4 μm with GHz-level modulation. However, single nanowire LEDs suffer from issues with low output power, complex fabrication process and poor device reliability. In contrast, nanowire array LEDs working in telecommunication O (1.26–1.36 µm) and C (1.53–1.565 µm) bands are more practical for industrial applications due to the improved output power and easy mass production. Compared with axial QW nanowires14, nanowires with radial QWs are more attractive for light-emitting device applications owing to the much larger active region, which could enable enhanced carrier recombination and light emission15, 16. However, the incorporation of InGaAs/InP radial QWs into {$ 1\bar{1}00 $} faceted wurtzite InP nanowires was shown to be challenging, as most of the nanowires suffered from non-uniform lateral growth and deteriorated morphology17, 18, which are unfavorable for device application. Recently, selective area growth of highly uniform InGaAs/InP multiple QWs based on {110} faceted polytypic InP nanowires has been demonstrated with excellent optical properties and low-threshold optically pumped lasing19, which may serve as a suitable platform for further development of nanowire array LEDs and electrically pumped lasers.
In this work, we report the growth and fabrication of p-i-n core-shell InGaAs/InP single QW nanowire array LEDs. As a result of structural variation in different crystal facets, axial and radial QWs in the nanowire are shown to emit at telecommunication wavelengths of ~1.35 and ~1.5 μm, respectively. Silvaco TCAD simulation reveals that due to the band-filling induced spectral blueshift from the axial and radial QWs, a large electroluminescence (EL) peak wavelength shift from the nanowire array LED is observed with increased bias. Multi-wavelength LEDs are further demonstrated by integrating multiple nanowire arrays with different pitch sizes on the same substrate, covering a large telecommunication window. Furthermore, GHz-level modulation and small-pixel micro-LEDs have been demonstrated, indicating excellent compatibility with WDM and MIMO technologies for future ultrafast on-chip communications20, PICs and Li-Fi applications.
Results and discussion
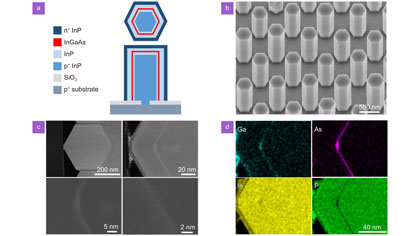
InGaAs/InP single QW nanowire arrays were grown by selective area metal-organic vapor phase epitaxy with a polytypic crystal structure19, and the details of the growth conditions can be found in the Experimental Section. The nanowire core is p-doped InP, while the InGaAs QW is sandwiched between two intrinsic InP barrier layers, and the outmost shell is n-doped InP, as illustrated in Fig. 1(a). Figure 1(b) presents the scanning electron microscope (SEM) images of a nanowire array with highly uniform morphology, in contrast to the wurtzite-based InAsP/InP17 and InGaAs/InP21 nanowires with unsymmetrical and nonuniform morphology, showing good potential for large-scale fabrication and integration. The nanowires grow along [111] direction with a perfect hexagonal shape and six identical {110} faceted sidewalls, with a diameter of ~390 nm and a length of ~1.1 µm. Microstructural analysis was performed by transmission electron microscopy (TEM) to check the lateral cross-sections of the nanowire, and the high-angle annular dark field (HAADF) image is shown in Fig. 1(c). Due to the atomic mass difference between InP and InGaAs layers, the InGaAs QW can be distinguished as a brighter hexagonal ring surrounding the InP nanowire core. The InGaAs radial QW is parallel to the {110} facets, while the QW corners are parallel to the {112} planes. Energy dispersive X-ray spectroscopy (EDX) measurements are used to analyse the chemical composition of the QW. Figure 1(d) presents the element mapping images of the nanowire, clearly showing that the InGaAs QW region is gallium- and arsenic-rich compared to the InP barrier region. Even though the indium and phosphorus precursor flows were temporarily switched off during the 5-sec InGaAs QW growth, there is still a high concentration of indium and phosphorus in the QW region, which could be ascribed to the arsenic-phosphorous, indium-gallium atomic interdiffusion and the presence of residual precursors in the chamber. Detailed composition analysis was performed by EDX line-scans across the radial QW on {110} facets and the QW corner, with the element composition estimated to be In0.92Ga0.08As0.3P0.7, In0.92Ga0.08As0.35P0.65, and In0.8Ga0.2As0.54P0.46 at the marked positions shown in
Fig. S1. The QW corners are observed to be much thicker with higher gallium/arsenic concentration than the radial QW on {110} facets, which is likely due to the diffusion rate difference between different growth species. It is known that indium adatoms have a longer diffusion length than gallium adatoms, which will move away from the higher surface energy {112} faceted corners more easily; thus, there is a lower indium concentration on the nanowire corner, as also observed in previous QW growth studies22, 23.

Figure 1.(a) Schematic of p-i-n InGaAs/InP single QW nanowire LED structure with lateral and vertical cross-sections. (b) 30° tilted view SEM image of the nanowire array with a pitch of 800 nm. (c) Cross-sectional STEM-HAADF image of a nanowire showing the hexagonal shape and radial QW under different magnifications. (d) EDX elemental maps of the cross-sectional region in (c).
The optical properties of the InGaAs/InP single QW nanowires were characterized at room-temperature by cathodoluminescence (CL).
Figure S2(a, b) present the SEM and corresponding panchromatic (coverage 1–1.6 μm) CL intensity mapping of a mechanically transferred nanowire on a silicon substrate; the bright and uniform CL emission indicates continuous coverage of the radial QW along the nanowire’s long axis instead of the short and truncated radial QW grown on WZ InGaAs/InP nanowires, which are favorable for increasing light emission intensity from the nanowire LEDs. CL spectral mapping was also performed along the nanowire’s growth axis, as shown in Fig. 2(a). It can be seen that the CL emission from the nanowire top region is mainly located at the wavelength range of 1.25–1.35 μm, while those from the middle and bottom parts are located in the range of 1.45–1.6 μm. The corresponding CL spectra from the nanowire’s top, middle and bottom regions can be found in Fig. 2(b). Figure 2(c–e) present the SEM image and corresponding two-dimensional integrated CL intensity mapping at the wavelength range of 1.25–1.35 μm and 1.45–1.55 μm, respectively. Figure 2(f) presents the overlaid false-color CL image of Fig. 2(d, e), where the pink region indicates axial QW CL emission at a shorter wavelength of 1.25–1.35 μm and the yellow region shows radial QW emission at a longer wavelength of 1.45–1.5 μm. In contrast, it is worth mentioning that for wurtzite InGaAs/InP single QW nanowires, longer wavelength peaks from axial QW and shorter wavelength peaks from radial QW were observed21, which could be attributed to the structural (thickness and composition) variation in the axial and radial QWs, due to growth rate differences in different conditions18. In wurtzite based InGaAs/InP single-QW nanowires, axial growth is usually dominant at higher temperatures and lower V/III ratio conditions14, resulting in a much thicker axial QW and thinner radial QW formation (shorter wavelength). On the other hand, the polytypic InGaAs/InP single QW nanowires are grown at a relatively lower temperature and higher V/III ratio conditions so that lateral growth rate on {110} facets is promoted, resulting in relatively thicker radial QW with increased arsenic incorporation and longer wavelength emission.
Figure 2.(a) SEM-CL spectral mapping of the InGaAs/InP single QW nanowire along the growth axis. The dashed rectangle indicates the relative position of the nanowire. (b) CL spectrum is acquired from the nanowire’s top, middle, and bottom region, respectively. (c) SEM image of the nanowire with the white arrow indicating nanowire growth direction. (d–e) Spectrally integrated intensity map at 1250–1350 nm and 1450–1550 nm. (f) Overlaid false-color CL image of (d–e), the pink and yellow region indicates the integrated CL intensity at 1250–1350 nm and 1450–1550 nm, corresponding to the emission from axial and radial QW, respectively.
Figure 3(a) presents the schematic of the fabricated nanowire array LED, and the fabrication process can be found in the Experimental Section. Figure 3(b) shows the light output power-voltage (L-V) and current-voltage (I-V) curves of the nanowire array LED under forward bias (a full-scale I-V curve showing a typical rectifying p-n junction behavior is presented in
Fig. S3). Under the forward bias, the current grows exponentially with the increase of voltage, indicating the dominance of recombination current in the p-n junction. The current equation can be expressed as
, where n is the ideality factor and
is the series resistance, estimated to be ~1.0 kΩ. A large resistance is usually observed in nanowire-based diodes, which could be attributed to the low doping concentration of the p-type nanowire core and the contact resistance of ITO24. Nevertheless, the turn-on voltage (~0.75 V) for the nanowire array LED is close to the photon voltage (the EL emission peak at 1.57 µm in Fig. 3(c) corresponds to a photon energy of 0.79 eV), which may be ascribed to the large valence band offset of InGaAs/InP QW structure such that the hole density in the QW is high even at low bias conditions, leading to the possibility of low voltage or even sub-photon voltage operation beneficial for high-efficiency light emission25.
Figure S4 presents the image of the fabricated nanowire array LED captured by an infrared camera under various biases, showing brighter EL emission at higher voltages. The output power shows a nonlinear increase with the applied bias and reaches ~17 μW at 10 V, which is six times higher than the output power of wurtzite-based InGaAs/InP QW nanowire array LED26 of the same device size. This may be attributed to the improved morphology uniformity and thus enhanced light extraction efficiency.
Figure 3.(a) Schematic of fabricated nanowire array LED. (b) L-I and I-V curves of a representative nanowire array LED. (c) Voltage-dependent EL spectra at room temperature. (d) Normalized voltage-dependent EL spectra from (c). (e) Simulated voltage-dependent spontaneous emission spectra. (f) Simulated emission spectrum at the bias of 1.2 V, with the decoupled contribution from axial and radial quantum wells.
Figure 3(c, d) present the raw and normalized bias-dependent EL spectra measured at room temperature. The overall EL intensity increases with the applied bias, indicating increased radiative recombination due to larger carrier injection at a higher voltage. On the other hand, broadband EL spectra are observed in the wavelength region of 1.0–1.7 μm instead of 0.8–1.0 μm, indicating that the EL emission originates from InGaAs QW rather than InP nanowire core or barriers. Two prominent EL peaks can be identified from the spectra, including a long wavelength peak at ~1.5 μm and a short wavelength peak at ~1.35 μm. Due to the presence of two EL peaks, the FWHM of the EL spectrum could reach ~ 286 nm, showing great promise for optical coherence tomography and bio-sensing applications27, 28. The longer wavelength EL peak dominates the spectra at low biases (1.5–4.0 V) and shows a blueshift from ~1.56 μm (1 V) to ~1.46 μm (4 V). Such a blueshift could enable voltage-tunable multi-wavelength operation at the telecommunication C band, as shown by normalized EL spectra in Fig. 3(d). The shorter wavelength EL peak (~1.35 μm) gradually becomes more dominant as the bias increases (> 4.0 V) with very little blueshift. Such a complex spectral behavior (multiple EL peaks and bias-dependent blueshift) has also been observed in nanostructure-based micro-LEDs, attributed to different reasons, including heterogeneous material incorporation and nonuniform current injection path10, 29, 30. As suggested by the study in n-p doped core-shell InGaN/GaN nanowire LEDs31, current injection takes place predominantly in the top nanowire region at low bias, while there is progressively increased current injection towards the nanowire bottom region at higher bias due to the lower mobility of holes compared to that of electrons. For our p-i-n InGaAs/InP core-shell single QW nanowire, the hole transport path from the bottom of the p-doped core via radial QW to n-doped InP shell is much shorter than the path towards the top axial QW; thus hole current injection into radial QW is expected to be more effective than that through the axial QW.
To understand the bias-dependent EL peak shift in this work, we simulated the bias-dependent spontaneous emission spectra of a two-dimensional (2D) InGaAs/InP single-QW device in a single nanowire with Silvaco TCAD software. The schematic of the 2D device structure is shown in
Fig. S5(a), and detailed input parameters are summarized in
Table S1. Figure 3(e) shows the simulated bias-dependent EL spectra. The general trend and two EL peaks closely resemble the measured counterpart in Fig. 3(c), indicating a good match between the simulation and experiment. To unravel the origins of two EL peaks, the emission spectrum is decomposed into the ones due to radial and axial QWs, respectively, shown in Fig. 3(f). It can be found that the longer wavelength EL peak at ~1.5 μm originates from the radial QW; in comparison, the shorter wavelength EL peak at ~1.35 μm is a combined result of axial QW emission and the higher energy part of radial QW emission. Since the radial QW occupies a much larger device volume and there is a more efficient carrier injection through the radial QW, the simulated EL intensity from radial QW is always higher than that from axial QW. As the bias increases, large carrier injection quickly leads to band filling in both QWs (see band diagrams of QWs in
Fig. S5(b) and
S5(c)), causing much-broadened emission spectra and increasingly dominant EL peak at ~1.35 μm.
Based on the spectral behavior of our nanowire array LEDs, we further explored the multi-wavelength tunability by simultaneously growing nanowire arrays with varied pitch sizes of 0.8, 1.0, and 2.0 μm on the same substrate, as shown by the SEM images in
Fig. S6. The increased pitch size enables a more abundant precursor supply and thus enhances lateral growth. Assuming a proportional increase in the lateral growth rate, QW formed in a larger pitch nanowire array is also expected to be thicker; element incorporation into the QW with different pitch sizes could also be different. Therefore, by manipulating the nanowire array pitch size that leads to multiple QW thicknesses and material fractions, it is possible to integrate multi-wavelength micro-LEDs on the same substrate in a single epitaxial growth. Figure 4(a) presents the measured average nanowire diameter as a function of array pitch size. It can be seen that the average nanowire diameter increases significantly, from ~380 to ~700 nm, as array pitch size increases; on the other hand, the heights of the nanowires from arrays with different pitch sizes are quite similar due to the limited axial growth in the low temperature and high V/III ratio growth conditions, in contrast to the large height variation in previously reported wurtzite based nanowires32, 33. This relatively uniform nanowire height promises a significant advantage in fabricating nanowire array devices with different pitch sizes on the same substrate for multi-pixel device applications34. Figure 4(b) shows the representative PL spectra collected from nanowire arrays with different pitch sizes, showing longer wavelength PL emission from larger pitch nanowire arrays, which could be ascribed to the increased QW thickness or indium incorporation into the QW35. Based on the PL measurement, nanowire array LEDs with pitch sizes of 0.8, 1.0, and 2.0 μm were fabricated on the same substrate, with the corresponding EL spectra at a bias of 1.5 V as shown in Fig. 4(c). Consistent with the PL results, EL emission from larger pitch nanowire array LED was observed at a longer wavelength, with the peak wavelength of the bias-dependent EL spectra extended from ~1.57 μm (pitch 0.8 μm array) to ~1.67 um (pitch 2.0 μm array), which covers the telecommunication C band. Figure 4(d) summarizes the bias-dependent (from 1 to 4 V) EL peak wavelength for all pitch sizes with more than 100 nm blueshift obtained for each case, indicating a wide emission wavelength tunability across the telecommunication wavelength regime.
Figure 4.(a) Average diameter of InGaAs/InP single QW nanowire from arrays with a pitch size of 0.8, 1.0 and 2.0 μm. (b) Representative PL spectra measured from the top of the nanowire arrays with different pitch sizes. (c) EL spectra measured at a forward bias of 1.5 V from nanowire array LED with different pitch sizes. (d) Peak wavelength of the bias-dependent EL spectra from nanowire array LED with different pitch sizes.
Ultrafast operation is indispensable for high-speed photonic integrated circuits and optical communication networks. The modulation speed of an LED is limited by carrier recombination time and RC constants. To evaluate the ultrafast performance of the nanowire array LEDs, the carrier recombination lifetime was first investigated by the time-resolved photoluminescence (TRPL) technique. The schematic of the PL/TRPL measurement setup can be found in
Fig. S7(a). Figure 5(a) shows the spectrally integrated (1.0−1.7 μm) PL decay characteristics of the QW emission at room temperature, and the minority carrier lifetimes were estimated to be ~309 ps by fitting the decay curve with a single exponential model36, which is much shorter than the lifetime of pure InP nanowire (~1 ns)19, as a result of efficient carrier recombination in the QW. Thus, our nanowire array LED promises a theoretical upper limit of ~3 GHz modulation.
Figure 5.(a) TRPL decay curve measured from the top of the nanowire array. (b) TREL signal collected from pitch 0.8 µm nanowire array LED at modulation frequencies of 0.1, 0.6 and 1 GHz. (c) 30° tilted SEM image of the nanowire arrays arranged corresponding to the letters “ANU”. (d) Infrared camera image of the EL emission from nanowire array LEDs in (c) under various current injection levels.
The electrical modulation performance of the nanowire array LED was also investigated by the time-resolved electroluminescence (TREL) technique37 (see the schematic of the measurement setup in
Fig. S7(b)). A DC offset (
) was added to a sinusoidal signal (
) with different repetition frequencies for device operation. Here, high voltage was used to exploit the fastest response of the device, as the cut-off frequency was reported to increase with higher carrier injection level and reduction in active layer thickness38. Figure 5(b) shows the modulated output from the nanowire array LED at different frequencies (0.1, 0.6, and 1 GHz). The sinusoidal shape of the TREL signal indicates that the nanowire LED can be modulated at the GHz level, which is most likely RC constant-limited, considering its short carrier recombination lifetime and large series resistance. To further improve the modulation speed, the large device series resistance (
kΩ) could be addressed by peeling off the InP substrate39 and increasing the nanowire core/shell doping concentration. On the other hand, optimization of ITO contact size and quality could also reduce the parasitic capacitance to improve high-speed operation performance.
Moreover, the QW nanowire arrays also provide great potential for further boosting the communication capacity by integrating multiple multi-wavelength LEDs with much-reduced sizes on the same chip to achieve wavelength division multiplexing. As a proof of concept, multiple small-size micro-LED arrays with pixel sizes less than 5 µm arranged to the letters of “ANU” were grown under the same conditions used for large array growth. The large lateral growth leading to nonuniform and merged morphology is shown in Fig. 5(c). The uniformity issue can be addressed by finely tuning the growth parameter (growth time and rate) for smaller array growth, and the infrared camera image of multiple micro-LED arrays emitting under various biases is presented in Fig. 5(d), indicating the promise of integrating multiple multi-wavelength micro-LEDs on the same chip. Further works are underway on contacting single-standing nanowires or small-size nanowire arrays to allow individually addressable single light-emitting pixels for multiplexing applications.
Conclusions
In conclusion, we have demonstrated selective area growth and fabrication of highly uniform p-i-n core-shell InGaAs/InP single QW nanowire array LEDs, with both axial and radial QWs contributing to the electroluminescence at wavelengths of ~1.35 and 1.5 μm, respectively. The EL of the nanowire array LED exhibited strong bias-dependent spectral shift due to the band-filling effect, indicating a voltage-controlled multi-wavelength (1.35–1.6 μm) operation covering telecommunication wavelengths. The great compatibility of the nanowire array LEDs with WDM and MIMO technologies for high-speed communication was further illustrated by the monolithic growth and fabrication of nanowire array LEDs with different pitch sizes and much-reduced array sizes (< 5 μm in width) on the same substrate, as well as GHz-level modulation. This work provides a promising pathway for developing nanoscale on-chip light sources for next generation integrated optical communication systems.
Experimental section
SAE nanowire growth: Nanowire growth was conducted in a close-coupled showerhead MOVPE (Aixtron CCS 3×2 in) system. A 30 nm thick SiO2 layer was deposited on p-doped InP (111)A substrate as the growth mask, and the patterning and preparation process for SAE growth can be found in previous work36. The prepared substrates were first annealed in ambient PH3 at a wafer surface temperature of 658 °C for 10 min. After annealing, the p-doped InP nanowire core was grown at 615 °C for 10 min at a V/III ratio of 4214 using molar fractions of
,
and
for trimethylindium, PH3, and diethylzinc, respectively. The InGaAs QW was grown at a molar fraction of
and
for trimethylgallium and arsine, respectively, while the indium supply relied on the atomic diffusion and the subsequent precursor residual after the InP growth. The InGaAs QW layer was grown for 5 s, while the InP barrier was grown for 10 s. Then an additional n-doped InP layer was grown for 3 min with a silane molar fraction of
, while the TMIn and PH3 flow rates were kept the same as those used for the InP core growth.
Nanowire characterization: The morphology of the nanowires was characterized by an FEI Verios 460 SEM. A Gatan MonoCL4 Elite CL spectroscopy system equipped with an InGaAs detector was used to perform the CL measurements. STEM and EDX analyses were performed by an FEI Themis-Z double-corrected STEM system equipped with the Super-X EDS detector system of four silicon drift detectors and a total solid angle of 0.9 srad.
Nanowire array LED fabrication: A thick layer of photoresist (SU-8) was spin-coated onto the nanowire arrays as an insulation layer, where the size of a standard array was 200 μm × 200 μm. The photoresist was etched by O2 plasma to expose the nanowire tips, and indium tin oxide was deposited on top of the nanowire array using a DC magnetron sputtering system as the top transparent contact. Titanium and gold were deposited by an electron beam evaporator on the p+ InP substrate as the bottom contact.
PL, EL, and I-V characterization: A homemade confocal microscope with SpectraPro2300 and InGaAs detector was used to characterize the emission spectrum from the nanowire arrays. For PL measurement, a solid state 532 nm continuous-wave laser, chopped at 333 Hz, was used to excite the nanowire array. For EL spectrum measurement, the nanowire array LEDs were driven by a 1 kHz square pulse signal with various bias voltages. The PL/EL optical signal was collected by a 10× objective lens and spectrally dispersed by a monochromator, and then detected by an InGaAs detector. The signal from the InGaAs detector was fed into a lock-in amplifier (SR830) and SpectraHub for analysis. For EL power measurement, the light output power was measured using an integrating sphere (OMH-6708B InGaAs power head) at 0.8–1.6 μm. The device biasing and I-V measurements were performed using a Keysight B2902A source and measurement unit.
TRPL and TREL measurements: For TRPL measurement, the nanowire array was excited using a 522 nm pulsed laser with a pulse duration of 300 fs and 20.8 MHz repetition rate. For TREL measurements, the device was connected via a bias-tee to a microscope-compatible chamber (Linkam Chamber) with electrical feedthroughs. The DC offset was provided by a DC power supply (TENMA 72-10495), while the RF input was connected to a signal generator (R&S®SML01) with a source resistance of 50 Ω, capable of providing a sinusoidal signal up to 1 GHz. For the TRPL/TREL signal detection, the optical signal is collected by a 10× objective lens and detected by an avalanche photodetector (PDM-IR) with a whole spectral detection window at 1.0–1.7 μm, which is then analyzed by a time-correlated single photon counting (TCSPC) system. The schematic of the measurement setup is shown in
Fig. S6.
Acknowledgements
The authors would like to acknowledge the financial support from the Australian Research Council. Access to the epitaxial growth and device fabrication facilities is made possible through the Australian National Fabrication Facility, ACT node. The authors acknowledge the technical support and helpful discussion by Dr. Jiangtao Qu and Hongwei Liu from the Sydney Microscopy & Microanalysis, Microscopy Australia Sydney Node, at the University of Sydney (Sydney Microscopy & Microanalysis). F. Zhang thanks the China Scholarship Council and the Australian National University for scholarship support.
The authors declare no competing financial interests.
Supplementary information for this paper is available at
https://doi.org/10.29026/oes.2023.230003