• Chinese Journal of Lasers
  • Vol. 47, Issue 12, 1201004 (2020)
Yan Wenbing1、2, Yang Yong1、*, Ji Kaijun1、2, Ye Hui1、2、3, Cheng Xuewu1, Yang Guotao4, Liu Zhongzheng1、2, Wang Jiqin1、2, Lin Xin1, Song Shalei1, Zheng Jinzhou1, Xiao Yiran1, Du Lifang4, and Li Faquan1
Author Affiliations
  • 1State Key Laboratory of Magnetic Resonance and Atomic and Molecular Physics Innovation Academy for Precision Measurement Science and Technology, Chinese Academy of Sciences, Wuhan, Hubei 430071, China
  • 2University of Chinese Academy of Sciences, Beijing 100049, China
  • 3Shanghai Institution of Satellite Engineering, Shanghai 201109, China
  • 4State Key Laboratory of Space Weather, National Space Science Center, Chinese Academy of Sciences, Beijing 100190, China
  • show less
    DOI: 10.3788/CJL202047.1201004 Cite this Article Set citation alerts
    Yan Wenbing, Yang Yong, Ji Kaijun, Ye Hui, Cheng Xuewu, Yang Guotao, Liu Zhongzheng, Wang Jiqin, Lin Xin, Song Shalei, Zheng Jinzhou, Xiao Yiran, Du Lifang, Li Faquan. Multichannel Single-Pulse Laser Energy Monitoring Methodology[J]. Chinese Journal of Lasers, 2020, 47(12): 1201004 Copy Citation Text show less
    Multichannel single-pulse laser energy change monitoring device
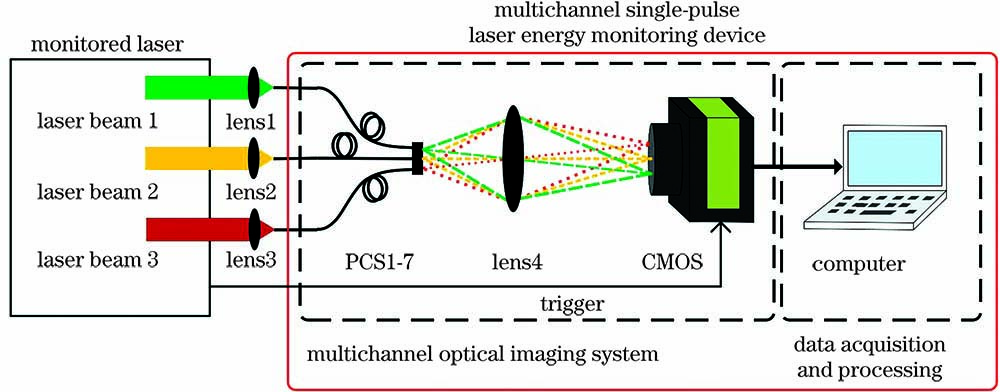
    Fig. 1. Multichannel single-pulse laser energy change monitoring device
    Laser spot distribution on CMOS surface, in which the round spot is the image of fiber bundle. (a) Spot image of the PCS1-7; (b) spot image of the PCS1-50
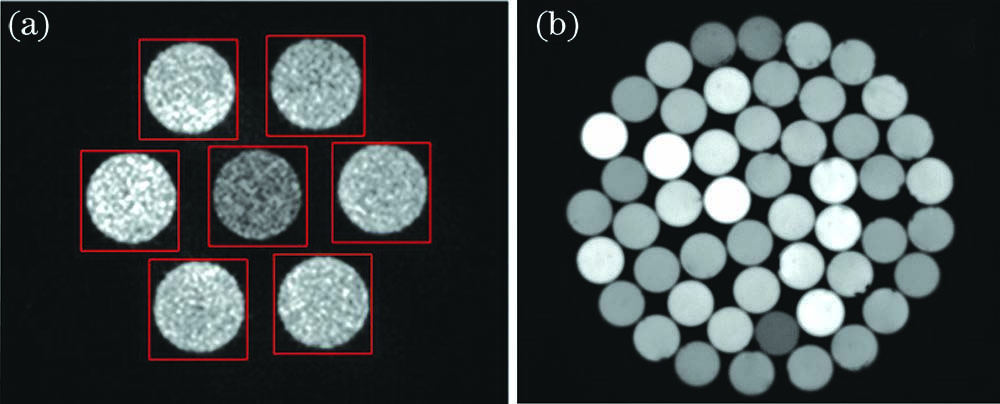
    Fig. 2. Laser spot distribution on CMOS surface, in which the round spot is the image of fiber bundle. (a) Spot image of the PCS1-7; (b) spot image of the PCS1-50
    Flow chart of data acquisition and processing program
    Fig. 3. Flow chart of data acquisition and processing program
    Light layout for comparison of measurement results between multichannel single-pulse laser energy change monitoring device and power meter
    Fig. 4. Light layout for comparison of measurement results between multichannel single-pulse laser energy change monitoring device and power meter
    Relationship between laser power and gray scale value
    Fig. 5. Relationship between laser power and gray scale value
    Optical layout of the four channels single-pulse laser energy monitoring
    Fig. 6. Optical layout of the four channels single-pulse laser energy monitoring
    Monitoring results. (a) Four channels laser energy versus time; (b) efficiency of the secondary harmonic generation, conversion efficiency of pulsed dye laser, and ASE ratio versus time
    Fig. 7. Monitoring results. (a) Four channels laser energy versus time; (b) efficiency of the secondary harmonic generation, conversion efficiency of pulsed dye laser, and ASE ratio versus time
    Device componentParameter
    Fiber (PCS1-7)Transmission band: 400--1100nm
    Numerical aperture: 0.22
    Transmittance per meter: 0.9--0.99(400--1100nm)
    LensFocal length: 30.00 mm
    Diameter: 25.4 mm
    CMOSPixel size: 6μm×6μm
    Frame rate/resolution: 120frame/s @640pixel×480pixel
    Spectral responsivity: 390--1100nm
    Shutter type: Global exposure
    Exposure time: 15.667--912.634ms
    Table 1. Parameters of multichannel optical imaging unit
    Yan Wenbing, Yang Yong, Ji Kaijun, Ye Hui, Cheng Xuewu, Yang Guotao, Liu Zhongzheng, Wang Jiqin, Lin Xin, Song Shalei, Zheng Jinzhou, Xiao Yiran, Du Lifang, Li Faquan. Multichannel Single-Pulse Laser Energy Monitoring Methodology[J]. Chinese Journal of Lasers, 2020, 47(12): 1201004
    Download Citation