• Chinese Physics B
  • Vol. 29, Issue 8, (2020)
Chao Wang1、2, Wen Xu1、3、†, Hong-Ying Mei1、4, Hua Qin5, Xin-Nian Zhao1、2, Hua Wen1、2, Chao Zhang1, Lan Ding3, Yong Xu6, Peng Li6, Dai Wu6, and Ming Li6
Author Affiliations
  • 1Key Laboratory of Materials Physics, Institute of Solid State Physics, Chinese Academy of Sciences, Hefei 23003, China
  • 2University of Science and Technology of China, Hefei 3006, China
  • 3School of Physics and Astronomy and Yunnan Key Laboratory for Quantum Information, Yunnan University, Kunming 650091, China
  • 4Faculty of Information Engineering, Huanghuai University, Zhumadian 63000, China
  • 5Key Laboratory of Nanodevices and Applications, Suzhou Institute of Nano-tech and Nano-bionics, Chinese Academy of Sciences, Suzhou 21123, China
  • 6Institute of Applied Electronics, Chinese Academy of Engineering Physics, Mianyang 21900, China
  • show less
    DOI: 10.1088/1674-1056/ab961b Cite this Article
    Chao Wang, Wen Xu, Hong-Ying Mei, Hua Qin, Xin-Nian Zhao, Hua Wen, Chao Zhang, Lan Ding, Yong Xu, Peng Li, Dai Wu, Ming Li. Picosecond terahertz pump–probe realized from Chinese terahertz free-electron laser[J]. Chinese Physics B, 2020, 29(8): Copy Citation Text show less
    Schematic diagram of THz macro- and micro-pulse structure of CTFEL.
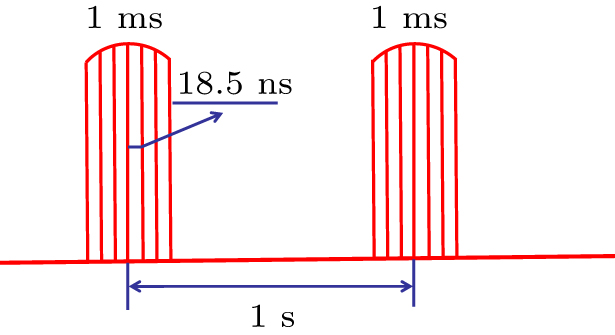
    Fig. 1. Schematic diagram of THz macro- and micro-pulse structure of CTFEL.
    Autocorrelation measurement of THz pulses of the CTFEL at three different frequencies. Together with Fourier transformation of these data, we can determine the width of THz pulses in both time- and frequency-domains.
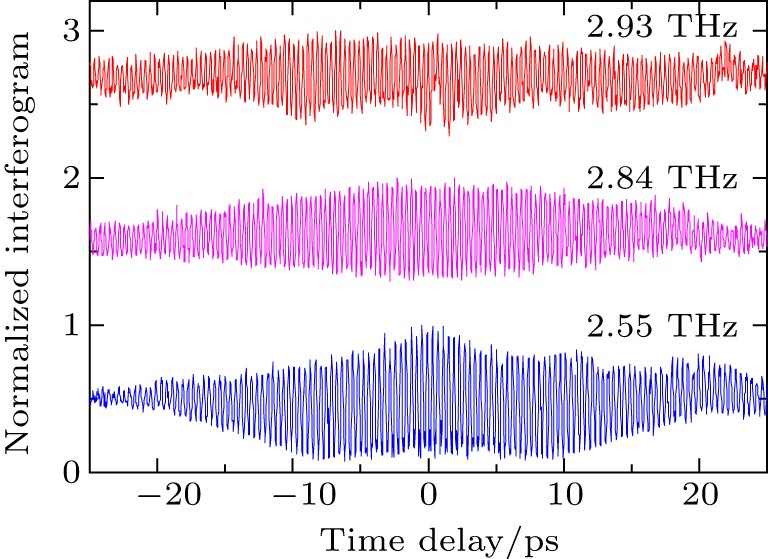
    Fig. 2. Autocorrelation measurement of THz pulses of the CTFEL at three different frequencies. Together with Fourier transformation of these data, we can determine the width of THz pulses in both time- and frequency-domains.
    Schematic diagram of ps THz pump–probe system based on CTFEL.
    Fig. 3. Schematic diagram of ps THz pump–probe system based on CTFEL.
    Plots of transmission intensity versus delay time for different pumping frequencies as indicated. Smooth curves are the results given by Eq. (3) for 1.6 THz and 2.4 THz and coarse curves are the raw data of experimental results.
    Fig. 4. Plots of transmission intensity versus delay time for different pumping frequencies as indicated. Smooth curves are the results given by Eq. (3) for 1.6 THz and 2.4 THz and coarse curves are the raw data of experimental results.
    Chao Wang, Wen Xu, Hong-Ying Mei, Hua Qin, Xin-Nian Zhao, Hua Wen, Chao Zhang, Lan Ding, Yong Xu, Peng Li, Dai Wu, Ming Li. Picosecond terahertz pump–probe realized from Chinese terahertz free-electron laser[J]. Chinese Physics B, 2020, 29(8):
    Download Citation