• Acta Physica Sinica
  • Vol. 69, Issue 16, 168702-1 (2020)
Jia Zhang, Soham Samanta, Jia-Lin Wang, Lu-Wei Wang, Zhi-Gang Yang, Wei Yan*, and Jun-Le Qu*
Author Affiliations
  • Key Laboratory of Optoelectronic Devices and Systems of Ministry of Education and Guangdong Province, College of Physics and Optoelectronic Engineering, Shenzhen University, Shenzhen 518060, China
  • show less
    DOI: 10.7498/aps.69.20200171 Cite this Article
    Jia Zhang, Soham Samanta, Jia-Lin Wang, Lu-Wei Wang, Zhi-Gang Yang, Wei Yan, Jun-Le Qu. Study on a novel probe for stimulated emission depletion Super-resolution Imaging of Mitochondria[J]. Acta Physica Sinica, 2020, 69(16): 168702-1 Copy Citation Text show less
    Schematic diagram of STED: (a) Diagram of energy level for stimulated emission depletion; (b) schematic diagram of STED light spot.
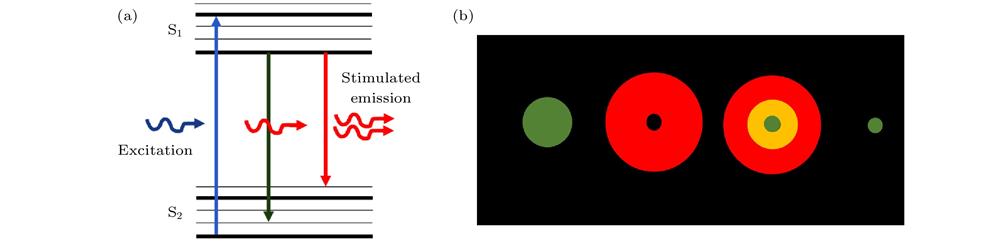
    Fig. 1. Schematic diagram of STED: (a) Diagram of energy level for stimulated emission depletion; (b) schematic diagram of STED light spot.
    Chemical structure and spectra characterization of target probe: (a) Chemical structure of probe 1; (b) excitation spectra of probe1 (blue)and 2 (red); (c) emission spectra of probe1 (blue) and 2 (red); (d) excitation spectrum of probe 1 (blue) and emission spectrum of probe 2 (red).
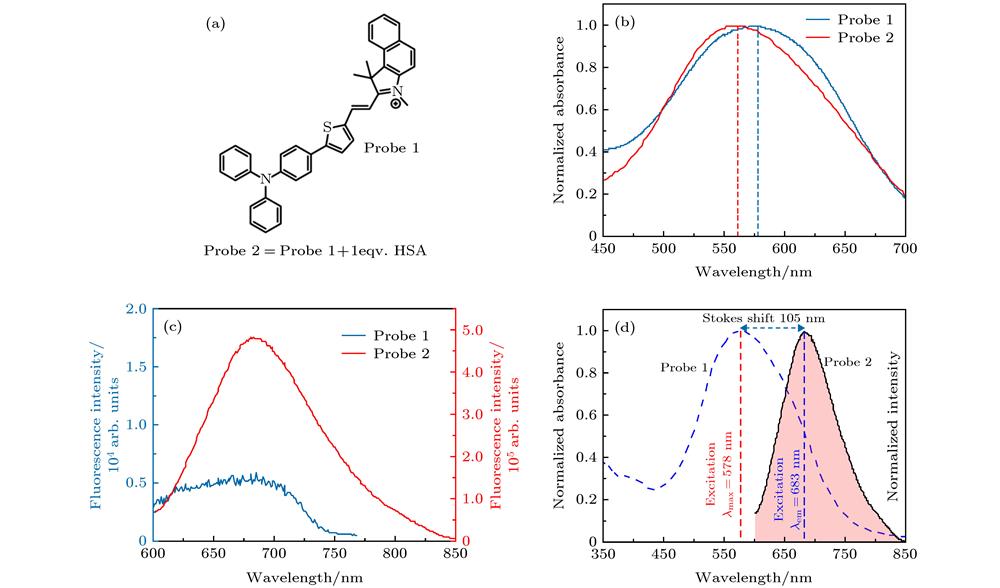
    Fig. 2. Chemical structure and spectra characterization of target probe: (a) Chemical structure of probe 1; (b) excitation spectra of probe1 (blue)and 2 (red); (c) emission spectra of probe1 (blue) and 2 (red); (d) excitation spectrum of probe 1 (blue) and emission spectrum of probe 2 (red).
    Confocal images of HeLa cells labeled with probe 1 and probe 2. Scale bar is 10 μm: (a) Confocal image of HeLa cells labeled with probe 1; (b) confocal image of HeLa cells labeled with probe2.
    Fig. 3. Confocal images of HeLa cells labeled with probe 1 and probe 2. Scale bar is 10 μm: (a) Confocal image of HeLa cells labeled with probe 1; (b) confocal image of HeLa cells labeled with probe2.
    Co-localization images of Hela cells treated with Mito Tracker Green FM and Probe 2. Scale bar is 10 μm: (a) Image of Mito Tracker Green FM; (b) image of probe 2; (c) overlay of image (a) and (b).
    Fig. 4. Co-localization images of Hela cells treated with Mito Tracker Green FM and Probe 2. Scale bar is 10 μm: (a) Image of Mito Tracker Green FM; (b) image of probe 2; (c) overlay of image (a) and (b).
    Cell images illuminated by light of different wavelengths: (a) Illuminated by light of 561 nm; (b) illuminated by light of 660 nm; (c) illuminated by light of 775 nm.
    Fig. 5. Cell images illuminated by light of different wavelengths: (a) Illuminated by light of 561 nm; (b) illuminated by light of 660 nm; (c) illuminated by light of 775 nm.
    Confocal and STED images of HeLa cells labeled with probe 2. Scale bar is 500 nm: (a) Confocal image; (b) STED image of mitochondria obtained with 19.75 mW STED light; (c) STED image of mitochondria obtained with 39.5 mW STED light; (d)−(f) normalized signal intensity profiles along the lines in (a)−(c) respectively as well as the spatial resolutions.
    Fig. 6. Confocal and STED images of HeLa cells labeled with probe 2. Scale bar is 500 nm: (a) Confocal image; (b) STED image of mitochondria obtained with 19.75 mW STED light; (c) STED image of mitochondria obtained with 39.5 mW STED light; (d)−(f) normalized signal intensity profiles along the lines in (a)−(c) respectively as well as the spatial resolutions.
    Effect of STED power on imaging performance: (a) Stimulated emission depletion efficiency of Probe 2; (b) resolution of STED images obtained at increased depletion power.
    Fig. 7. Effect of STED power on imaging performance: (a) Stimulated emission depletion efficiency of Probe 2; (b) resolution of STED images obtained at increased depletion power.
    Results of bleaching test. Inset pictures are the images of single cell obtained after the first scan, 180 th scan, and 360 th scan. Scale bar is 10 μm.
    Fig. 8. Results of bleaching test. Inset pictures are the images of single cell obtained after the first scan, 180 th scan, and 360 th scan. Scale bar is 10 μm.
    Jia Zhang, Soham Samanta, Jia-Lin Wang, Lu-Wei Wang, Zhi-Gang Yang, Wei Yan, Jun-Le Qu. Study on a novel probe for stimulated emission depletion Super-resolution Imaging of Mitochondria[J]. Acta Physica Sinica, 2020, 69(16): 168702-1
    Download Citation