• Acta Physica Sinica
  • Vol. 69, Issue 11, 119601-1 (2020)
Zhen Zhong1、*, Teng Zhang1, Jie Zhang2, and Shi-Guo Chen1
Author Affiliations
  • 1School of Physics and Electronic Science, Guizhou Normal University, Guiyang 550001, China
  • 2School of Geography and Resources, Guizhou Education University, Guiyang 550018, China
  • show less
    DOI: 10.7498/aps.69.20200114 Cite this Article
    Zhen Zhong, Teng Zhang, Jie Zhang, Shi-Guo Chen. Illumination and temperature analysis for CE-5 candidate landing site Mons Rümker[J]. Acta Physica Sinica, 2020, 69(11): 119601-1 Copy Citation Text show less
    Topography around Mons Rümker region, which is figured out with a white box. The black box indicates the candidate landing site of CE-5 proposed by reference [10], and this site is centered at (303.34ºE, 40.11ºN)
    Fig. 1. Topography around Mons Rümker region, which is figured out with a white box. The black box indicates the candidate landing site of CE-5 proposed by reference [10], and this site is centered at (303.34ºE, 40.11ºN)
    Schematic of illumination condition
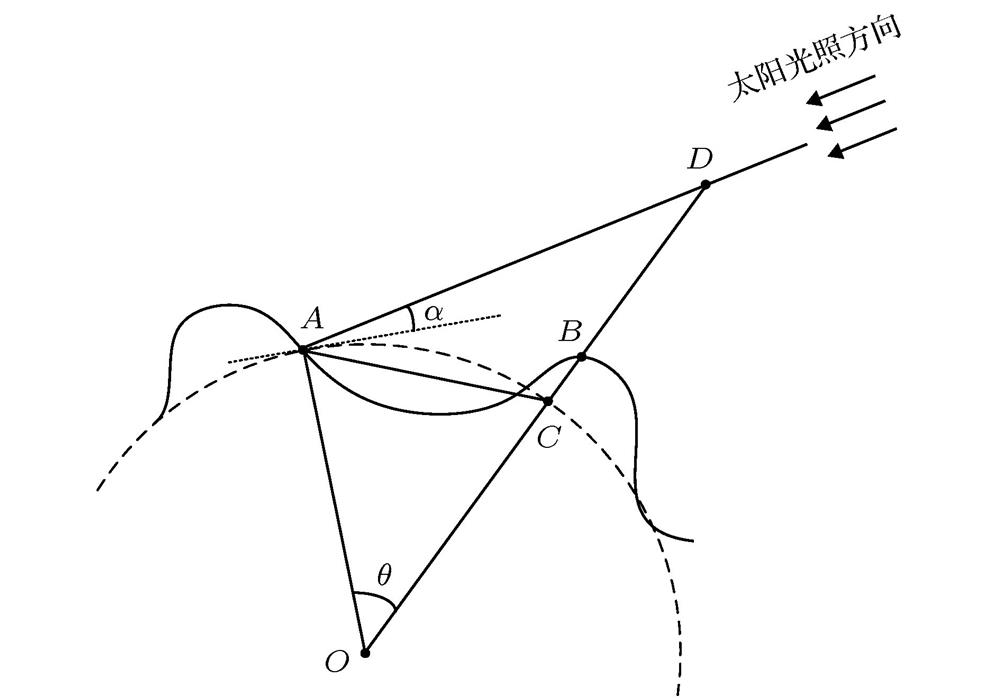
    Fig. 2. Schematic of illumination condition
    Morning map of illumination over Mons Rümker at the lunar local time tm = 06:30:30: (a) Japan’s SELENE morning map of illumination; (b) our estimated relative intensity of illumination at the same time of Fig. 3(a)
    Fig. 3. Morning map of illumination over Mons Rümker at the lunar local time tm = 06:30:30: (a) Japan’s SELENE morning map of illumination; (b) our estimated relative intensity of illumination at the same time of Fig. 3(a)
    Surface temperature distribution with time over Mons Rümker plateau: (a) Time at UTC 2020-10-28T 11:30:00; (b) time at UTC 2020-10-29T 06:45:00; (c) time at UTC 2020-10-30T 06:45:00; (d) time at UTC 2020-11-02T 04:45:00; (e) time at UTC 2020-11-12T 02:45:00; (f) time at UTC 2020-11-12T 17:00:00
    Fig. 4. Surface temperature distribution with time over Mons Rümker plateau: (a) Time at UTC 2020-10-28T 11:30:00; (b) time at UTC 2020-10-29T 06:45:00; (c) time at UTC 2020-10-30T 06:45:00; (d) time at UTC 2020-11-02T 04:45:00; (e) time at UTC 2020-11-12T 02:45:00; (f) time at UTC 2020-11-12T 17:00:00
    Subsurface temperature distribution at the depth of 5 cm over Mons Rümker plateau: (a) Time at UTC 2020-10-28T 11:30:00; (b) time at UTC 2020-10-29T 06:45:00; (c) time at UTC 2020-10-30T 06:45:00; (d) time at UTC 2020-11-02T 04:45:00; (e) time at UTC 2020-11-12T 02:45:00; (f) time at UTC 2020-11-12T 17:00:00
    Fig. 5. Subsurface temperature distribution at the depth of 5 cm over Mons Rümker plateau: (a) Time at UTC 2020-10-28T 11:30:00; (b) time at UTC 2020-10-29T 06:45:00; (c) time at UTC 2020-10-30T 06:45:00; (d) time at UTC 2020-11-02T 04:45:00; (e) time at UTC 2020-11-12T 02:45:00; (f) time at UTC 2020-11-12T 17:00:00
    Temperature variation along the longitude direction shown in Fig.1: (a) Time at UTC 2020-10-28T 11:30:00; (b) time at UTC 2020-10-29T 06:45:00; (c) time at UTC 2020-10-30T 06:45:00; (d) time at UTC 2020-11-02T 04:45:00; (e) time at UTC 2020-11-12T 02:45:00; (f) time at UTC 2020-11-12T 17:00:00. The black carves in Fig. 6(d) represents the surface topography along the same blue line direction displayed in Fig. 1
    Fig. 6. Temperature variation along the longitude direction shown in Fig.1: (a) Time at UTC 2020-10-28T 11:30:00; (b) time at UTC 2020-10-29T 06:45:00; (c) time at UTC 2020-10-30T 06:45:00; (d) time at UTC 2020-11-02T 04:45:00; (e) time at UTC 2020-11-12T 02:45:00; (f) time at UTC 2020-11-12T 17:00:00. The black carves in Fig. 6(d) represents the surface topography along the same blue line direction displayed in Fig. 1
    Subsurface temperature variations: (a) Variations for the point of CE-5 candidate landing site; (b) variations for the black star in Fig. 1
    Fig. 7. Subsurface temperature variations: (a) Variations for the point of CE-5 candidate landing site; (b) variations for the black star in Fig. 1
    Subsurface temperature variations with depth for the point of black star in Fig. 1: (a) Temperature variations at the lunar local time tm = 06:30:30; (b) temperature variations at the lunar local time tm = 12:30:30; (c) temperature variations at the lunar local time tm = 18:30:30
    Fig. 8. Subsurface temperature variations with depth for the point of black star in Fig. 1: (a) Temperature variations at the lunar local time tm = 06:30:30; (b) temperature variations at the lunar local time tm = 12:30:30; (c) temperature variations at the lunar local time tm = 18:30:30
    序号参数取值
    1密度ρsρd[14]ρs = 1100 kg·m–3, ρd = 1800 kg·m–3
    2热传导系数kskd[14]ks = 7.4 × 10⁻⁴ W·m–1·K–1, kd = 3.4 × 10⁻³ W·m–1·K–1
    3比热容拟合系数[14]c0, c1, c2, c3, c4c0 = –3.6125 J·kg –1·K–1, c1 = 2.7431 J·kg–1·K–2, c2 = 2.3616 × 10⁻³ J·kg–1·K–3, c3 = –1.234 × 10 –5 J·kg–1·K–4, c4 = 8.9093 × 10⁻⁹ J·kg–1·K–5
    4参数Hx[13,14]H = 0.06 m, x = 2.7
    Table 1. Values of parameters used in study
    深度/mtm = 06:30:30 tm = 12:30:30 tm = 18:30:30
    H = 0.02 m H = 0.09 m Q = 0.012 W·m–2Q = 0.021 W·m–2H = 0.02 m H = 0.09 m Q = 0.012 W·m–2Q = 0.021 W·m–2H = 0.02 m H = 0.09 m Q = 0.012 W·m–2Q = 0.021 W·m–2
    0170.0169.6169.7169.7348.1351.7350.9350.9122.3110.7112.9112.9
    0.0136158.5149.4152.3152.3322.5325.7324.4324.4213.6205.6207.1207.1
    0.0526192.4194.5194.4194.4270.6261.1263.2263.2260.9260.7260.1260.1
    0.1000221.3223.8223.2223.2237.9231.9233.6233.6260.3253.9255.3255.3
    0.1822239.3239.6239.5239.5234.0235.1234.7234.7243.0239.5240.4240.4
    0.3240241.2241.2241.2241.2240.8240.9240.8240.8240.0240.2240.1240.1
    0.4721241.2241.2241.2241.2241.3241.3241.3241.3241.2241.3241.3241.3
    0.8250242.4242.4242.4242.4242.4242.4242.4242.4242.4242.4242.4242.4
    1.0000242.9242.9242.7243.1242.9242.9242.7243.1242.9242.9242.7243.1
    Table 2. Temperature (in K) variations with depth for the point of black star in Fig. 1 at various lunar local time
    Zhen Zhong, Teng Zhang, Jie Zhang, Shi-Guo Chen. Illumination and temperature analysis for CE-5 candidate landing site Mons Rümker[J]. Acta Physica Sinica, 2020, 69(11): 119601-1
    Download Citation