• Acta Physica Sinica
  • Vol. 69, Issue 3, 037201-1 (2020)
Zhi-Chao Guo1、2、*, Tong-Yao Zhang1、2, and Jing Zhang1、2
Author Affiliations
  • 1State Key Laboratory of Quantum Optics and Quantum Optics Devices, Institute of Opto-Electronics, Shanxi University, Taiyuan 030006, China
  • 2Collaborative Innovation Center of Extreme Optics, Shanxi University, Taiyuan 030006, China
  • show less
    DOI: 10.7498/aps.69.20191623 Cite this Article
    Zhi-Chao Guo, Tong-Yao Zhang, Jing Zhang. Spin noise spectroscopy of cesium vapor in micron-scale cell[J]. Acta Physica Sinica, 2020, 69(3): 037201-1 Copy Citation Text show less
    (a) Schematic of the experimental apparatus (P-polarizer, B-magnetic fields, BP-balanced homodyne detector, FFT-fast Fourier transform); (b) typical spin noise spectrum of 133Cs in cell 1 (the laser is detuned ΩD2 = + 600 MHz from the D2 transition (62S1/2 (F = 4) → 62P3/2). The temperature of atomic cell is 296 K. The laser power P = 500 μW. Magnetic field B = 5 G); (c) D2 line transition and ground-state hyperfine structure of 133Cs.(a)自旋噪声谱的实验原理图(P是偏振片, B是外加磁场, Wollaston prism是沃拉斯顿棱镜, BP是平衡零拍探测器, FFT是快速傅里叶变换); (b)气室1中经典的133Cs自旋噪声谱(激光失谐频率ΩD2 = + 600 MHz于D2线(62S1/2 (F = 4) → 62P3/2), 原子气室温度T = 296 K, 激光功率P = 500 μW, 外加磁场B = 5 G); (c) 133Cs的D2跃迁线和基态超精细结构
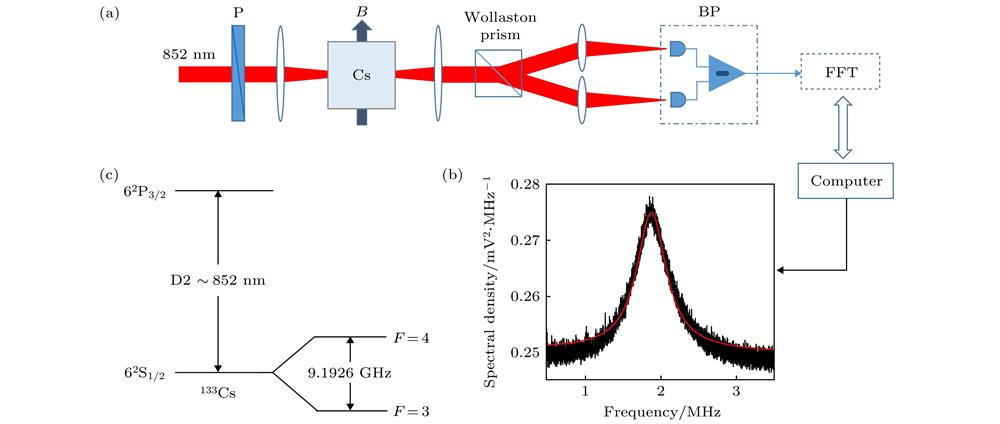
    Fig. 1. (a) Schematic of the experimental apparatus (P-polarizer, B-magnetic fields, BP-balanced homodyne detector, FFT-fast Fourier transform); (b) typical spin noise spectrum of 133Cs in cell 1 (the laser is detuned ΩD2 = + 600 MHz from the D2 transition (62S1/2 (F = 4) → 62P3/2). The temperature of atomic cell is 296 K. The laser power P = 500 μW. Magnetic field B = 5 G); (c) D2 line transition and ground-state hyperfine structure of 133Cs. (a)自旋噪声谱的实验原理图(P是偏振片, B是外加磁场, Wollaston prism是沃拉斯顿棱镜, BP是平衡零拍探测器, FFT是快速傅里叶变换); (b)气室1中经典的133Cs自旋噪声谱(激光失谐频率ΩD2 = + 600 MHz于D2线(62S1/2 (F = 4) → 62P3/2), 原子气室温度T = 296 K, 激光功率P = 500 μW, 外加磁场B = 5 G); (c) 133Cs的D2跃迁线和基态超精细结构
    Magnetic-field dependent spin noise spectrum in cell 1: (a) Spin noise spectrum (black lines) and fitting curve (red lines) versus the magnetic fields; (b) dependence of center frequency of spin noise spectrum on magnetic fields. The blue circles are the experimental data. The red line is the fitting curve. The laser is detuned ΩD2 = + 600 MHz from the D2 transition (62S1/2(F = 4) → 62P3/2). The laser power P = 500 μW. The temperature of atomic cell is 296 K.气室1中磁场相关的自旋噪声谱 (a)不同磁场下的自旋噪声谱(黑线)和拟合曲线(红线); (b)自旋噪声谱中心频率(蓝圆圈)与外场关系图, 以及拟合曲线(红线); 激光失谐频率ΩD2 = + 600 MHz于D2线(62S1/2 (F = 4) → 62P3/2), 激光功率为P = 500 μW, 原子气室温度T = 296 K
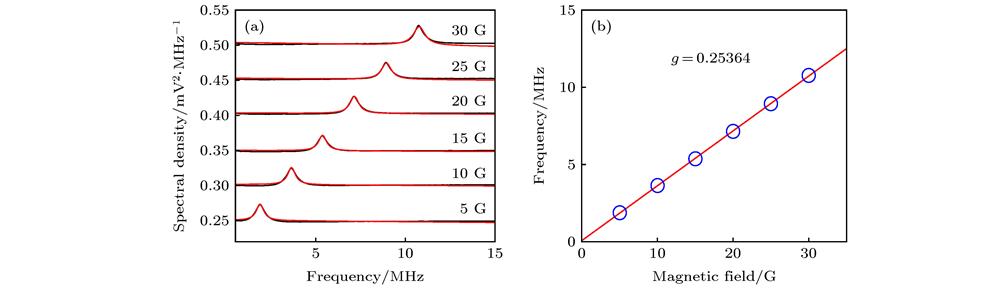
    Fig. 2. Magnetic-field dependent spin noise spectrum in cell 1: (a) Spin noise spectrum (black lines) and fitting curve (red lines) versus the magnetic fields; (b) dependence of center frequency of spin noise spectrum on magnetic fields. The blue circles are the experimental data. The red line is the fitting curve. The laser is detuned ΩD2 = + 600 MHz from the D2 transition (62S1/2(F = 4) → 62P3/2). The laser power P = 500 μW. The temperature of atomic cell is 296 K. 气室1中磁场相关的自旋噪声谱 (a)不同磁场下的自旋噪声谱(黑线)和拟合曲线(红线); (b)自旋噪声谱中心频率(蓝圆圈)与外场关系图, 以及拟合曲线(红线); 激光失谐频率ΩD2 = + 600 MHz于D2线(62S1/2 (F = 4) → 62P3/2), 激光功率为P = 500 μW, 原子气室温度T = 296 K
    Detuning frequency dependent spin noise spectrum in cell 1: (a) Spin relaxation rate versus the detuning frequency; (b) total noise versus the detuning frequency. The laser is detuned from the D2 transition (62S1/2(F = 3) → 62P3/2). The laser power P = 500 μW. Magnetic field B = 15 G. The blue circles are the experimental data. The red line is the fitting curve. The temperature of atomic cell is 296 K.气室1中自旋噪声谱的失谐频率依赖关系 (a)自旋弛豫速率与失谐频率的对应关系图; (b)总噪声与失谐频率的对应关系图; 激光失谐频率在D2线(62S1/2(F = 3) → 62P3/2)附近, 激光功率P = 500 μW, 外磁场B = 15 G, 实验数据为(蓝圆圈)和拟合曲线(红线), 原子气室温度T = 296 K
    Fig. 3. Detuning frequency dependent spin noise spectrum in cell 1: (a) Spin relaxation rate versus the detuning frequency; (b) total noise versus the detuning frequency. The laser is detuned from the D2 transition (62S1/2(F = 3) → 62P3/2). The laser power P = 500 μW. Magnetic field B = 15 G. The blue circles are the experimental data. The red line is the fitting curve. The temperature of atomic cell is 296 K. 气室1中自旋噪声谱的失谐频率依赖关系 (a)自旋弛豫速率与失谐频率的对应关系图; (b)总噪声与失谐频率的对应关系图; 激光失谐频率在D2线(62S1/2(F = 3) → 62P3/2)附近, 激光功率P = 500 μW, 外磁场B = 15 G, 实验数据为(蓝圆圈)和拟合曲线(红线), 原子气室温度T = 296 K
    The detuning frequency dependent spin noise spectrum in cell 2: (a) Spin relaxation rate versus the detuning frequency at T = 387 K; (b) spin relaxation rate versus the detuning frequency at T = 431 K; (c) total noise versus the detuning frequency at T = 387 K; (d) total noise versus the detuning frequency at T = 431 K. The laser is detuned from the D2 transition (62S1/2(F = 3) → 62P3/2). The laser power P = 5 mW. The blue circles are the experimental data, and the red line is the fitting curve.气室2中自旋噪声谱的失谐频率依赖关系 (a) T = 387 K时自旋弛豫速率与失谐频率的关系; (b) T = 431 K时自旋弛豫速率与失谐频率的关系; (c) T = 387 K时总噪声与失谐频率的关系; (d) T = 431 K时总噪声与失谐频率的关系; 激光失谐频率在D2线(62S1/2(F = 3) → 2P3/2)附近, 激光功率为P = 5 mW, 蓝圆圈表示实验数据, 红线为拟合曲线
    Fig. 4. The detuning frequency dependent spin noise spectrum in cell 2: (a) Spin relaxation rate versus the detuning frequency at T = 387 K; (b) spin relaxation rate versus the detuning frequency at T = 431 K; (c) total noise versus the detuning frequency at T = 387 K; (d) total noise versus the detuning frequency at T = 431 K. The laser is detuned from the D2 transition (62S1/2(F = 3) → 62P3/2). The laser power P = 5 mW. The blue circles are the experimental data, and the red line is the fitting curve. 气室2中自旋噪声谱的失谐频率依赖关系 (a) T = 387 K时自旋弛豫速率与失谐频率的关系; (b) T = 431 K时自旋弛豫速率与失谐频率的关系; (c) T = 387 K时总噪声与失谐频率的关系; (d) T = 431 K时总噪声与失谐频率的关系; 激光失谐频率在D2线(62S1/2(F = 3) → 2P3/2)附近, 激光功率为P = 5 mW, 蓝圆圈表示实验数据, 红线为拟合曲线
    Zhi-Chao Guo, Tong-Yao Zhang, Jing Zhang. Spin noise spectroscopy of cesium vapor in micron-scale cell[J]. Acta Physica Sinica, 2020, 69(3): 037201-1
    Download Citation