
Ling Qin, Dongxing Wang, Mingquan Shi, Fengying Wang, Xiaoli Hu. Indoor Visible Light Localization System Based on Genetic Algorithm-Optimized Extreme Learning Machine Neural Network[J]. Chinese Journal of Lasers, 2022, 49(21): 2106001
- Chinese Journal of Lasers
- Vol. 49, Issue 21, 2106001 (2022)
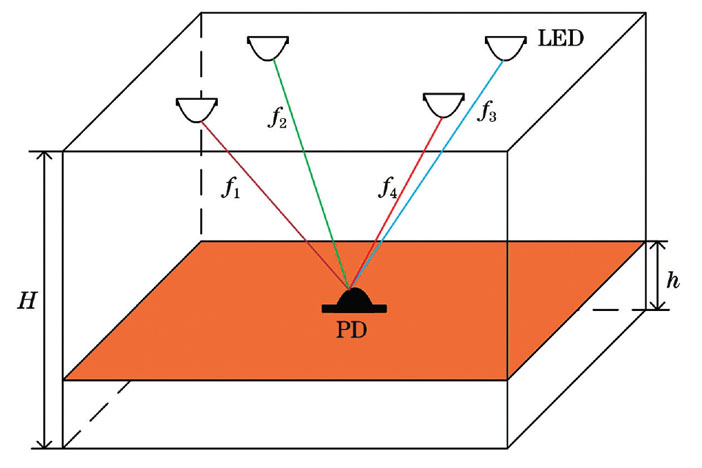
Fig. 1. Indoor visible light positioning model
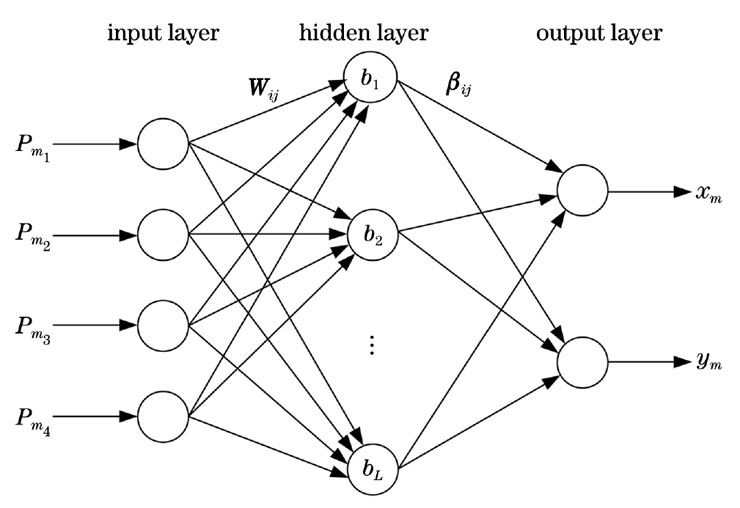
Fig. 2. ELM network structure
Fig. 3. Genetic algorithm flow chart
Fig. 4. GA-ELM algorithm flow chart
Fig. 5. Indoor three-dimensional localization distribution map
Fig. 6. Actual coordinates versus system predicted coordinates when receiver is at different altitudes. (a) 0.2 m; (b) 0.4 m; (c) 0.6 m; (d) 0.8 m
Fig. 7. Three-dimensional localization error of system when receiver is at different altitudes. (a) 0.2 m; (b) 0.4 m; (c) 0.6 m; (d) 0.8 m
Fig. 8. Localization error cumulative distribution of the system when receiver is at different altitudes
Fig. 9. Experimental scene and receiving end equipment. (a) Experimental scene; (b) receiving end equipment
Fig. 10. Two-dimensional localization results of GA-ELM
Fig. 11. Localization error histogram
Fig. 12. Cumulative distribution of localization error of GA-ELM and ELM algorithms
Fig. 13. Cumulative distribution of localization error of four algorithms
|
Table 1. Simulation results for selecting the number of LED
|
Table 2. Simulation parameters
|
Table 3. Simulation results for different training data sets
| |||||||||||||||||||||||||||||||||||||||||
Table 4. Maximum localization error for random 10 estimation results
|
Table 5. Comparison of localization errors of different algorithms
|
Table 6. Comparison of localization timeliness of different algorithms

Set citation alerts for the article
Please enter your email address
© Copyright 2018-2021 | Chinese Laser Press. All Rights Reserved 沪ICP备15018463号-20