• Matter and Radiation at Extremes
  • Vol. 8, Issue 3, 036901 (2023)
Seunggi Ham1, Jonghyeon Ryu1, Hakmin Lee1, Sungbin Park1, Y.-C. Ghim2, Y. S. Hwang1, and Kyoung-Jae Chung1、a)
Author Affiliations
  • 1Department of Energy Systems Engineering, Seoul National University, Seoul 08826, South Korea
  • 2Department of Nuclear and Quantum Engineering, KAIST, Daejeon 34141, South Korea
  • show less
    DOI: 10.1063/5.0131369 Cite this Article
    Seunggi Ham, Jonghyeon Ryu, Hakmin Lee, Sungbin Park, Y.-C. Ghim, Y. S. Hwang, Kyoung-Jae Chung. Estimation of plasma parameters of X-pinch with time-resolved x-ray spectroscopy[J]. Matter and Radiation at Extremes, 2023, 8(3): 036901 Copy Citation Text show less

    Abstract

    We estimate the parameters of a Cu plasma generated by an X-pinch by comparing experimentally measured x-rays with synthetic data. A filtered absolute extreme ultraviolet diode array is used to measure time-resolved x-ray spectra with a spectral resolution of ∼1 keV in the energy range of 1–10 keV. The synthetic spectra of Cu plasmas with different electron temperatures, electron densities, and fast electron fractions are calculated using the FLYCHK code. For quantitative comparison with the measured spectrum, two x-ray power ratios with three different spectral ranges are calculated. We observe three x-ray bursts in X-pinch experiments with two Cu wires conducted on the SNU X-pinch at a current rise rate of ∼0.2 kA/ns. Analysis of the spectra reveals that the first burst comprises x-rays emitted by hot spots and electron beams, with characteristics similar to those observed in other X-pinches. The second and third bursts are both generated by long-lived electron beams formed after the neck structure has been completely depleted. In the second burst, the formation of the electron beam is accompanied by an increase in the electron density of the background plasma. Therefore, the long-lived electron beams generate the additional strong x-ray bursts while maintaining a plasma channel in the central region of the X-pinch. Moreover, they emit many hard x-rays (HXRs), enabling the SNU X-pinch to be used as an HXR source. This study confirms that the generation of long-lived electron beams is crucial to the dynamics of X-pinches and the generation of strong HXRs.

    I. INTRODUCTION

    An X-pinch is formed by two or more wires that cross at a single point and is driven by a large current pulse from a pulsed power device.1 The emission of strong x-ray bursts from the center of the X-pinch acts as a near-instantaneous point source, and therefore X-pinches have been widely used for point-projection imaging of dynamic objects.2,3 In an X-pinch, x-ray bursts can be generated in two different ways. One is as thermal radiation emitted by a hot spot (HS), which is a hot, dense plasma produced by the implosion at the center of the X-pinch.4 The energy and amplitude of this HS burst depend directly on the state of the HS plasma. The other way is as x-ray radiation generated by the acceleration of electrons after the disruption of the HS. In this process, the electrons remaining near the HS region are believed to be accelerated by local energy and form fast electrons.5,6 Because they are generated by the thermal radiation of the plasma or by the interaction of fast electrons with the background plasma, x-ray bursts provide essential information on the dynamics of X-pinch plasmas.

    To date, several experimental studies have been conducted to characterize x-ray bursts5–9 and to consider fast electrons in x-ray spectrum analysis10–13 in X-pinches. Kantsyrev et al.9 suggested a multiburst regime, including electron beam generation, and Shlyaptseva et al.10 estimated the plasma parameters and fast electron fraction using x-ray spectroscopy. In particular, Shelkovenko et al.5 comprehensively studied fast electrons using various diagnostics, such as x-ray spectroscopy, Faraday cups, and collimated x-ray diodes. They identified two different pathways for the formation of electron beams. The first electron beam is formed immediately after the disruption of the neck structure. It produces x-ray emission a few nanoseconds following the HS burst, and these x-rays are sustained for several nanoseconds. The second beam is formed after the neck structure has been completely depleted. It generates an x-ray burst sustained for a few to tens of nanoseconds. Shelkovenko et al.5 categorized these two different types of electron beams as “short-lived electron beams” and “long-lived electron beams,” respectively.

    In this study, we analyze x-ray bursts and investigate the temporal behavior of X-pinch plasmas. Our analysis focuses particularly on late-time x-ray bursts generated by long-lived electron beams. We use a filtered absolute extreme ultraviolet (AXUV) diode array14 to measure the time-resolved x-ray spectrum with a spectral resolution of ∼1 keV in the energy range of 1–10 keV. The synthetic spectra of Cu plasmas with different electron temperatures, electron densities, fast electron fractions, and plasma sizes are calculated using the FLYCHK code. We present the details of spectroscopic methods to estimate plasma parameters using x-ray spectrum data and experimental results on the temporal behavior of an X-pinch with two Cu wires conducted on an SNU X-pinch.15

    II. X-RAY DIAGNOSTIC SYSTEM AND TYPICAL X-RAY BURSTS OF SNU X-PINCH

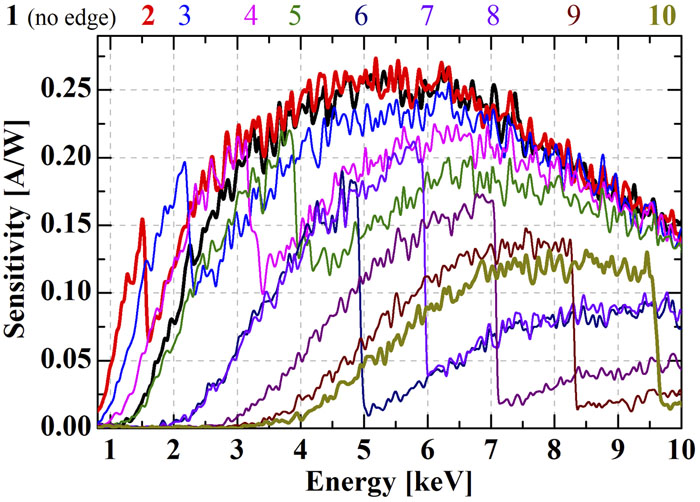
    The filtered AXUV diode array was developed in our previous study.14 It comprises ten AXUV-HS5 photodiodes (100 µm thick silicon diodes manufactured by the Opto Diode Corporation) and ten foil filters. All channels except for channel 1 have different spectral edges, as shown in Fig. 1; they are designed to cover 0.9–9.6 keV with a spectral resolution of ∼1 keV. The filter materials and sensitivities of the channels are shown in Table I and Fig. 1. The response curves were obtained using Geant4 simulations, and their sensitivities were adjusted using the widely known sensitivity of the AXUV-HS5 diodes, namely, 0.273 A/W.14 Channels 1–5 were for x-rays with energies below 2 keV. Their filters were combined with beryllium filters to block photons with energies of the order of hundreds of electron volts. Channels 6–10 were for x-rays with energies above 2 keV. They usually produce large signals when the plasma temperature is high or electron beams are generated. The filtered diodes were installed with five on each of the opposite windows of the SNU X-pinch and were 765 mm from the wire load, as shown in Fig. 2. The gap was extended from that of our previous study14 to reduce the intensity of the x-ray signals. The AXUV diodes were inspected to exclude defective ones by using soft x-ray tubes. In the X-pinch experiments, there was little difference in the x-ray signals measured by these systems with the same filter (10 µm thick Be). Therefore, we assumed that the x-rays in our measurement setup were nearly isotropic. The least-squares (LS) method14,16,17 was used to reconstruct a discrete x-ray spectrum from the signals of the filtered x-ray diodes and to calculate the x-ray powers of specific energy ranges from the reconstructed spectrum. Because the filtered AXUV diode array does not require a precise trigger for operation and measures x-rays during a long recording length of oscilloscopes that collect the signals from the channels, it can capture all the x-ray bursts from a single experiment.

    (a) CH12345
    FilterTeflonAlZrPdSn
    Thickness (μm)610.50.41
    (b) CH678910
    FilterTiCrFeNiZn
    Thickness (μm)1058912

    Table 1. Filter materials and their thicknesses: (a) low-energy channels combined with beryllium filters with a thickness of 10 µm; (b) high-energy channels for x-ray energies above 2 keV. Reproduced with permission from Ham et al., Rev. Sci. Instrum. 92(5), 053509 (2021). Copyright 2021 AIP Publishing.

    Response curves of the filtered AXUV diode array. The positions of the channel numbers indicate the spectral edges of each channel. Reproduced with permission from Ham et al., Rev. Sci. Instrum. 92(5), 053509 (2021). Copyright 2021 AIP Publishing.

    Figure 1.Response curves of the filtered AXUV diode array. The positions of the channel numbers indicate the spectral edges of each channel. Reproduced with permission from Ham et al., Rev. Sci. Instrum. 92(5), 053509 (2021). Copyright 2021 AIP Publishing.

    SNU X-pinch with the filtered AXUV diode array. The filtered AXUV diode array is mounted with half on each of the opposite vacuum ports. The distance between the wire load and AXUV diodes is 765 mm. Reproduced with permission from Ham et al., Rev. Sci. Instrum. 92(5), 053509 (2021). Copyright 2021 AIP Publishing.

    Figure 2.SNU X-pinch with the filtered AXUV diode array. The filtered AXUV diode array is mounted with half on each of the opposite vacuum ports. The distance between the wire load and AXUV diodes is 765 mm. Reproduced with permission from Ham et al., Rev. Sci. Instrum. 92(5), 053509 (2021). Copyright 2021 AIP Publishing.

    The Cu wire X-pinch experiments were conducted on the SNU X-pinch.15 Two Cu wires with a thickness of 25 µm were used for the X-pinch load. The gap between the electrodes on which the wires were loaded was 10 mm, and the two wires were 8 mm apart. The current generator of the SNU X-pinch comprised a triggered spark gap switch and a capacitor bank with eight low-inductance capacitors. It was charged to 50 and 55 kV; the respective maximum currents at these voltages were 100 and 110 kA, and the current rise rates were 0.197 and 0.214 kA/ns, as shown in Fig. 3.

    Currents measured by short circuit test. Black and red lines show the currents generated with charging voltages of 50 and 55 kV, respectively.

    Figure 3.Currents measured by short circuit test. Black and red lines show the currents generated with charging voltages of 50 and 55 kV, respectively.

    Figures 4 and 5 show typical x-ray signals of Cu wire X-pinches at each charging voltage. Several x-ray peaks were generated in all shots, and the x-ray emission times in the 50 and 55 kV cases were 69 and 87 ns, respectively. These systems showed the typical x-ray emission properties of the SNU X-pinch. We divided the x-ray peaks into three bursts (first, second, and third), as shown by the yellow areas in Figs. 4(a) and 5(a). Figures 4(b)4(d) and 5(b)5(d) show the first, second, and third bursts in greater detail. The first bursts rose quickly and were maintained for a relatively short time. Channels 6–10 produced strong signals at 55 kV; however, weak signals were produced at 50 kV. This implies that x-rays with higher energy are emitted in the case of the 55 kV charging voltage. The second bursts were emitted 25–30 ns after the first x-ray peak and were maintained for a longer time. The signals of channels 1, 4, and 5 were almost identical. Thus, we can expect that the intensity of the x-rays is relatively weak between ∼1.5 and 7 keV, where the difference in response of these channels is large. Channel 10 yielded stronger signals than channels 6–9, which implies that strong x-rays were emitted between 8 and 10 keV. The third bursts were relatively weak, releasing successively after the second bursts. They resembled the second bursts, but the intensity decreased and channels 3–5 produced almost the same signal. We will estimate the temporal evolution of the plasma parameters for the three bursts and characterize them.

    (a) Typical x-ray signals of Cu wire X-pinches with charging voltages of 50 kV. The yellow areas indicate ranges of three bursts of x-rays. (b)–(d) Signals of the first, second, and third bursts, respectively, on narrower time scales.

    Figure 4.(a) Typical x-ray signals of Cu wire X-pinches with charging voltages of 50 kV. The yellow areas indicate ranges of three bursts of x-rays. (b)–(d) Signals of the first, second, and third bursts, respectively, on narrower time scales.

    (a) Typical x-ray signals of Cu wire X-pinches with charging voltages of 55 kV. The yellow areas indicate the ranges of three bursts of x-rays. (b)–(d) Signals of the first, second, and third bursts, respectively, on narrower time scales.

    Figure 5.(a) Typical x-ray signals of Cu wire X-pinches with charging voltages of 55 kV. The yellow areas indicate the ranges of three bursts of x-rays. (b)–(d) Signals of the first, second, and third bursts, respectively, on narrower time scales.

    III. DEVELOPMENT OF X-RAY SPECTROSCOPIC METHOD FOR ESTIMATION OF PLASMA PARAMETERS

    The plasma parameters can be estimated by comparing the synthetic spectra obtained from spectroscopic modeling with the measured spectra.1,18–22 The FLYCHK code,23 a simple collisional–radiative code, can quickly calculate reasonable spectra of most materials.23,24 It is thus suitable for performing spectral analysis with various plasma states and can be applied to high-Z materials with limited information. We chose the FLYCHK code, considering our limited computational resources and the possibility of future extension to other materials. The code includes two types of autoionization states, namely, inner shell excited and doubly excited states, in the calculations. For elements Z 27, including Cu, the HULLAC atomic data25 are utilized for quantum numbers n up to 4, with super-configurations with screened hydrogenic formalism being adopted for higher values of n.23–26 Transitions due to beam components and nonthermal electron collisions are also considered in the FLYCHK code, and it has therefore been utilized for the analysis of radiation with hot or fast electron components.26–28 The spectra obtained from the FLYCHK code were compared with those measured in several plasmas and were confirmed to be reasonable.23 Several studies have also shown that the FLYCHK code can calculate Cu K-shell radiation well.27–29 However, the range in which FLYCHK can calculate reasonable results is limited. A previous study24 compared the results of the ATOMIC and FLYCHK codes for Cu plasmas. The FLYCHK code yielded inaccurate results for strongly coupled plasmas (coupling parameter Γ > 1). The parameter ranges of plasmas in which we are interested, namely, 0.1–3 keV and 1018–1024 cm−3, do not correspond to those for strongly coupled plasma; Γ is ∼0.01 for an HS and ∼0.1 for a cold dense plasma (1023 cm−3, 0.1 keV). Therefore, we analyzed the synthetic spectra of Cu with different electron densities, electron temperatures, and fast electron fractions using the FLYCHK code for an X-pinch. The analysis was performed for two cases: with and without fast electrons. Spectra for the analysis were calculated with a plasma size of 10 µm.30 A discussion concerning the plasma size is presented in Sec. III C.

    A. Copper spectrum analysis without fast electrons

    The normalized synthetic spectra were calculated using the FLYCHK code with different electron temperatures and electron densities. Figure 6 shows spectra with different electron temperatures of 0.1, 0.8, and 1.5 keV and the same electron density of 1021 cm−3. In our measurement range, the Cu spectrum mainly comprised L-shell radiation in the range of 0.9–3.0 keV, K-shell radiation in the range of more than 8 keV, and continuum radiation. As the temperature increased, the slope of the continuum radiation increased, and both L-shell and K-shell radiation was enhanced. Because the slope of the recombination spectrum is inversely proportional to the electron temperature, the temperature can be calculated directly from that.31,32 However, the intensity of continuum radiation is weak compared with that of line radiation, and the measured continuum spectrum was significantly affected by measurement errors and electrical noise; therefore, we did not use the slope for temperature prediction. Conversely, the L-shell radiation was significantly affected by the increase in electron density, and the intensity of the continuum radiation increased significantly, as shown in Fig. 7. Thus, L-shell, K-shell, and continuum radiation varied differently with the electron temperature and density in our measurement range. Thus, this method can be utilized for plasma parameter estimation.

    Synthetic spectra of Cu plasma with electron temperatures of 0.1 (black), 0.8 (red), and 1.5 (blue) keV. The electron density is 1021 cm−3.

    Figure 6.Synthetic spectra of Cu plasma with electron temperatures of 0.1 (black), 0.8 (red), and 1.5 (blue) keV. The electron density is 1021 cm−3.

    Synthetic spectra of Cu plasmas with electron densities of 1021 (black) and 1023 (red) cm−3. The electron temperature is 0.8 keV.

    Figure 7.Synthetic spectra of Cu plasmas with electron densities of 1021 (black) and 1023 (red) cm−3. The electron temperature is 0.8 keV.

    We set three spectral ranges considering the changes in spectra due to the plasma parameters and spectral edges of the filtered AXUV diode array: the first range (R1) was the entire range of the AXUV array (0.9–9.6 keV), the second range (R2) covered 1.45–9.6 keV, and the third range (R3) covered 7.0–9.6 keV. Because of the low intensity of the continuum radiation, certain forms of L-shell radiation, which become more intense with increasing temperature and density, were included in R2 to distinguish it from R3. R3 mainly included K-shell radiation. To quantify these changes, we integrated the Cu spectra in each range, and the integrated values were proportional to the power of the x-rays. To compare the three spectral ranges of the synthetic spectra with those of the measured spectra, the x-ray power ratios of R2 and R1 and those of R3 and R1 were calculated; we call these the first and second ratios r1 and r2, respectively. To account for errors from the spectrum reconstruction process, the synthetic spectra were reconstructed using the LS method, as shown in Fig. 8. The x-ray power ratios were calculated from the reconstructed spectra S as follows:r1=R2SEdER1SEdE,r2=R3SEdER1SEdE.

    Reconstructed (dotted) and synthetic (solid) spectra with different plasma parameters: (a) electron density 1023 cm−3, electron temperature 1.0 keV, and fast electron fraction 20%; (b) electron density 1022 cm−3, electron temperature 1.5 keV, and fast electron fraction 0%.

    Figure 8.Reconstructed (dotted) and synthetic (solid) spectra with different plasma parameters: (a) electron density 1023 cm−3, electron temperature 1.0 keV, and fast electron fraction 20%; (b) electron density 1022 cm−3, electron temperature 1.5 keV, and fast electron fraction 0%.

    The x-ray power ratios were precalculated under the following conditions, and the results are shown in Fig. 9. The electron densities were set from 1018 to 1024 cm−3 and the electron temperatures were set from 0.1 to 3 keV. Overall, the ratios increased with increases in the electron temperature and density. When the electron density was less than 1021 cm−3, however, the ratios varied only slightly with changing electron density; therefore, it was difficult to determine the electron density from 1018 to 1020 cm−3. r1 is more important in determining the temperature, because r2 showed only small differences at temperatures below ∼1.5 keV. In summary, the electron temperature and density were estimated by comparing the measured and precalculated x-ray power ratios. However, it should be noted that the accuracy of these estimates may be lower for relatively low-density plasmas.

    X-ray power ratios with different electron temperatures and electron densities obtained from the FLYCHK code: (a) first ratio r1; (b) second ratio r2.

    Figure 9.X-ray power ratios with different electron temperatures and electron densities obtained from the FLYCHK code: (a) first ratio r1; (b) second ratio r2.

    B. Copper spectrum analysis with fast electrons

    Fast electrons can be considered in the form of hot electrons with the second distribution function owing to their energy being higher than that of a bulk plasma. The FLYCHK code adds a second electron component with a Maxwellian or non-Maxwellian distribution to the calculation; therefore, we utilized this function. The important factors in modeling fast electrons are their distribution function, characteristic energy, and fraction. Fast electrons were simulated using Gaussian, Maxwellian, and power-law distributions. The effect on the spectrum varies depending on the distribution adopted for the fast electrons; however, the exact distribution of the fast electrons is unknown.12 Because determination of the exact distribution of the fast electrons is outside the aims of our research, we modeled them using as Maxwellian distribution, following what was done in a previous study.11 Nevertheless, to minimize the influence of the distribution function, the characteristic energy was set to 10 keV, which is greater than the maximum value of the spectral range that we measure.12 On the one hand, the characteristic energy can also affect the spectrum. The x-ray spectrum emitted by an HS with a high electron temperature is affected by the characteristic energy, as shown in Fig. 10; if the plasma temperature is low, the x-ray spectra will exhibit greater variations, depending on the characteristic energy, as shown in Fig. 11. This is because there are fewer high-energy electrons in the bulk plasma with a low electron temperature, which increases the influence of the fast electron component. However, its characteristic energy is unknown.

    Synthetic spectra with different characteristic energies of 10 (black), 20 (red), and 30 (blue) keV. The electron temperature and density are 1.6 keV and 1023 cm−3, respectively, which are similar to those of an HS. The fast electron fraction is 9%.

    Figure 10.Synthetic spectra with different characteristic energies of 10 (black), 20 (red), and 30 (blue) keV. The electron temperature and density are 1.6 keV and 1023 cm−3, respectively, which are similar to those of an HS. The fast electron fraction is 9%.

    Synthetic spectra with different characteristic energies of 10 (black), 20 (red), and 30 (blue) keV. The electron temperature and density are 0.1 keV and 1023 cm−3, respectively, which correspond to a low-temperature plasma. The fast electron fraction is 9%.

    Figure 11.Synthetic spectra with different characteristic energies of 10 (black), 20 (red), and 30 (blue) keV. The electron temperature and density are 0.1 keV and 1023 cm−3, respectively, which correspond to a low-temperature plasma. The fast electron fraction is 9%.

    Spectra with different proportions of fast electrons to total electrons were obtained using the FLYCHK code. Figure 12 shows spectra with 0% and 5% of fast electrons in a background plasma where the electron temperature and density were 0.8 keV and 1021 cm−3, respectively. According to the results of previous studies,11,12 the high-energy continuum and K-shell radiation were strengthened. The x-ray power ratios were precalculated with various fast electron fractions; the electron temperature and electron density were set as in the previous case. Figures 13(a) and 13(b) show the x-ray power ratios for a fast electron fraction of 1%. The ratios increased faster with increasing electron temperature and density than those without fast electrons. When the electron temperature was low, the ratios increased rapidly, in contrast to the previous case. In particular, the increases were noticeable at densities of less than 1020 and more than 1022 cm−3. This will aid in the discrimination of plasma parameters in the low-temperature range in the presence of fast electrons. Cases with higher fast electron fractions are illustrated in Figs. 13(c)13(f). As the fast electron fractions increased, the dependence of the x-ray power ratio on the electron temperature and density gradually increased. However, the ratios in the low-temperature range, which rose sharply in the 1% case, decreased, particularly below 1020 cm−3.

    Synthetic spectra with fast electron fractions of 0% (black) and 5% (red). The electron temperature is 0.8 keV and the electron density is 1021 cm−3.

    Figure 12.Synthetic spectra with fast electron fractions of 0% (black) and 5% (red). The electron temperature is 0.8 keV and the electron density is 1021 cm−3.

    X-ray power ratios with fast electron fractions of 1% [(a) and (b)], 5% [(c) and (d)], and 15% [(e) and (f)].

    Figure 13.X-ray power ratios with fast electron fractions of 1% [(a) and (b)], 5% [(c) and (d)], and 15% [(e) and (f)].

    C. Copper spectra with different plasma sizes

    X-rays are affected by the size of the high-density plasma used to emit them.11,19 Therefore, the plasma size should be considered in the calculation of x-ray spectra. Figure 14 shows x-ray spectra for various plasma sizes: optically thin, 1, 10, and 100 µm, and 1 mm. As the plasma size increases, the K-shell radiation is strengthened, especially for spectra at high temperatures. Conversely, except for the case of 1023 cm−3 and 0.8 keV [Fig. 14(b)], an increase in plasma size weakens the continuum radiation. The decrease in continuum radiation reduces r1 and r2, while the enhancement of the K-shell radiation increases these parameters. When the electron density is high, the continuum radiation is relatively less weakened, and the ratios are increased by the enhancement of the K-shell radiation, as shown in Figs. 14(b) and 14(d). Conversely, when the electron temperature and density are relatively low, the ratios decrease slightly or remain similar. For example, in the case of Fig. 14(a), r2 decreases from 6.1 × 10⁻⁵ to 4.5 × 10⁻⁵ as the plasma size increases from 1 to 10 µm. In the case of Fig. 14(d), where the electron temperature and density are relatively large, as the plasma size increases from 1 to 10 µm, r2 increases from 0.08 to 0.16; in particular, for a plasma size of 1 mm, r2 increases to 0.58. This tendency is maintained in the presence of fast electrons, as shown in Figs. 14(e) and 14(f). Consequently, the plasma sizes in the spectrum analysis significantly affect plasma parameter estimation. However, we do not presently possess a diagnostic tool to measure the plasma size. Therefore, for the x-ray bursts by the HS, a plasma size of 10 µm was assumed by reference to a previous study30 using a pulse generator with a current rise rate similar to that in the present study. X-ray bursts by fast electrons are known to be emitted in the range of 0.1–1 mm, and the Kα lines of a Cu plasma resulting from these x-rays were measured in the range of several millimeters.5 Therefore, we assumed a plasma size of 1 mm for the x-ray bursts by fast electrons.

    Synthetic spectra calculated with various plasma sizes: optically thin (black), 1 µm (red), 10 µm (blue), 100 µm (orange) and 1 mm (green). (a)–(d) Spectra without fast electrons: (a) and (b) spectra with electron temperature 0.8 keV and electron densities 1021 and 1023 cm−3, respectively; (c) and (d) spectra with electron temperature 1.5 keV and electron densities 1021 and 1023 cm−3, respectively. (e) and (d) Spectra with fast electron fraction 5%, electron temperature 0.8 keV, and electron densities of 1021 and 1023 cm−3, respectively.

    Figure 14.Synthetic spectra calculated with various plasma sizes: optically thin (black), 1 µm (red), 10 µm (blue), 100 µm (orange) and 1 mm (green). (a)–(d) Spectra without fast electrons: (a) and (b) spectra with electron temperature 0.8 keV and electron densities 1021 and 1023 cm−3, respectively; (c) and (d) spectra with electron temperature 1.5 keV and electron densities 1021 and 1023 cm−3, respectively. (e) and (d) Spectra with fast electron fraction 5%, electron temperature 0.8 keV, and electron densities of 1021 and 1023 cm−3, respectively.

    D. Plasma parameter estimation

    We analyzed x-ray power ratios for different plasma parameters. In the absence of fast electrons, the ratios increased with the electron temperature and density. Because each ratio has a different rate of increase, we can infer the electron temperature and electron density from this difference. The presence of fast electrons increases the overall x-ray power ratio and causes more complex changes in the low-temperature range. These changes in the power ratios due to the fast electrons also allow us to determine their fractions. A database of x-ray power ratios was constructed for comparison with the measurement results. The spectra for x-ray bursts by HSs were calculated for 55 electron densities (1018–1024 cm−3) and 30 electron temperatures (0.1–3.0 keV) with eight fast electron fractions (0%, 1%, 3%, 5%, 7%, 9%, 12%, and 15%). The spectra for the x-ray bursts by electron beams were calculated for 55 electron densities (1018–1024 cm−3) and ten electron temperatures (0.1–1.0 keV) with 11 fast electron fractions (0%, 1%, 3%, 5%, 7%, 9%, 12%, 15%, 20%, 25%, and 30%). Additionally, the x-ray power ratios vs the electron temperature were interpolated at intervals of 0.01 keV in the process of plasma parameter estimation.

    We confirm that the reconstructed spectra are matched with the corresponding synthetic spectra, as shown in Fig. 8; in particular, the increase in continuum and K-shell radiation is well represented. Therefore, the plasma parameters can be estimated by comparing the measured spectrum with the synthetic spectrum. An example of plasma parameter estimation from the first burst of the 50 kV case is shown in Fig. 15. Differences in the precalculated and measured x-ray power ratios were calculated, and the electron densities and temperatures for a certain fast electron fraction with a difference of less than 10% were plotted, as shown in Figs. 15(a) and 15(b). Because the differences in each power ratio exhibit different slopes, an area with small differences in the two power ratios can be specified, as shown in Fig. 15(c). Such areas were obtained for all fast electron fractions, and the point with the smallest difference was determined as the plasma parameter at a specific time. Plasma parameter estimation was performed with a time step of 0.32 ns, which is one of the x-ray signal measurements.

    Example of a comparison of the x-ray power ratios from the first peak of the 50 kV case. (a) and (b) Plasma parameters of the first and second ratios, respectively, with errors less than 10%. (c) Plasma parameters with averaged errors of the x-ray power ratios less than 10%.

    Figure 15.Example of a comparison of the x-ray power ratios from the first peak of the 50 kV case. (a) and (b) Plasma parameters of the first and second ratios, respectively, with errors less than 10%. (c) Plasma parameters with averaged errors of the x-ray power ratios less than 10%.

    However, although there are several factors to be considered when constructing synthetic x-ray data and measuring x-rays, we only considered a simple situation. Thus, we estimated the possible plasma parameters and not the exact values. For example, the size and spatial distribution of the plasma affect the spectrum, and several plasmas can be present simultaneously for a short time. However, we measured the integrated spectrum in space. Therefore, we estimated the effective plasma parameters. In addition, the fast electron distribution in the X-pinch is unknown, which causes uncertainty in the plasma parameter estimation.

    IV. TEMPORAL EVOLUTION OF PLASMA PARAMETERS FOR X-RAY BURSTS AT SNU X-PINCH

    Figures 16 and 17 show the estimated plasma parameters of the first burst (1) in the x-ray signals of the 50 and 55 kV cases. The signals of channels 1 (black), 2 (red), and 10 (yellow) are presented together; they measure x-rays with energies greater than 1.6, 0.86, and 4.3 keV, respectively. The measurement ranges of channels 1 and 2 were similar to those of R1 and R2. Channel 10 measures only the continuum and K-shell radiation of the Cu spectrum, and we consider its signal to be representative of hard x-rays (HXRs), whose energy is larger than 7 keV, because K-shell radiation emitted in this energy range is much stronger than the continuum radiation in its measurement range. Plasma parameters estimated from peak-integrated powers are also presented to help identify the trend of plasma parameters between x-ray peaks; the error bars on the horizontal axis show integration intervals.

    Signals of channels 1, 2, and 10 and temporal evolution of estimated electron densities, electron temperatures, and fast electron fractions for the first burst of the 50 kV case. Estimated plasma parameters of three x-ray peaks from peak-integrated x-ray powers are plotted together.

    Figure 16.Signals of channels 1, 2, and 10 and temporal evolution of estimated electron densities, electron temperatures, and fast electron fractions for the first burst of the 50 kV case. Estimated plasma parameters of three x-ray peaks from peak-integrated x-ray powers are plotted together.

    Signals of channels 1, 2, and 10 and temporal evolution of estimated electron densities, electron temperatures, and fast electron fractions for the first burst of the 55 kV case. Estimated plasma parameters of two x-ray peaks from peak-integrated x-ray powers are plotted together.

    Figure 17.Signals of channels 1, 2, and 10 and temporal evolution of estimated electron densities, electron temperatures, and fast electron fractions for the first burst of the 55 kV case. Estimated plasma parameters of two x-ray peaks from peak-integrated x-ray powers are plotted together.

    In the 50 kV case, three consecutive x-ray peaks were emitted for ∼5 ns. Channels 1 and 2, which can measure low-energy x-rays, produced the largest signals at the first x-ray peak. However, channel 10 produced small signals and is multiplied by 10 in Fig. 16; this indicates that little continuum or K-shell radiation was released. The plasma parameters of the x-ray peaks were estimated. However, at the third peak, the plasma parameters could be estimated at only one point. This may have resulted from errors in the plasma reconstruction process. The electron densities increased rapidly with increasing x-ray signals, and those of each peak decreased from 1 × 10²³ to 2 × 1022 cm−3. Electron temperatures were estimated to be ∼1 keV at the first peak and gradually decreased to ∼0.55 keV at the last peak. The fast electron fractions were estimated to be ∼0%. A few fast electrons were consistent with the low signal of channel 10. In the 55 kV case, two x-ray peaks were released and were stronger than those of the 50 kV case, and the intensity of channel 10 was much stronger. At the first peak, the signals of channels 1 and 2 rose rapidly, whereas that of channel 10 rose slowly. At the second peak, the signals for channels 1 and 2 rose relatively slowly, and that of channel 10 was more intense. The temporal evolution of the plasma parameters was different from that of the 50 kV case, as shown in Fig. 17. The electron density and temperature of the first peak were ∼5 × 1023 cm−3 and 1.17 keV, respectively; they were also much higher than those of the 50 kV case. This may be because more energy was supplied to the load as the charging voltage increased. At the second peak, the electron density decreased to ∼4 × 1023 cm−3, and the electron temperature was ∼0.9 keV; the fast electron fractions increased from 0% to 5%. High fast electron fractions may indicate the formation of strong electron beams, which enhance the continuum and K-shell radiation, as shown in Fig. 12. This causes channels 6–10 of the first burst to produce relatively strong signals, as mentioned in Sec. II. In addition, the electron density and temperature decreased as the fast electron fraction increased at the second peak. This is because the energy deposited on the plasma decreases as a larger fraction of fast electrons transfers more energy.10

    Considering the x-ray signals and estimated plasma parameters, the first burst can be divided into two types of x-rays. The x-ray peaks of the 50 kV case and the first x-ray peak of the 55 kV case comprise strong soft x-rays (SXRs) and weak HXRs; they are the first peaks that rose rapidly. Thus, they may be thermal radiation emitted from the HSs, and their plasma parameters can be considered as parameters of the HSs. However, the second x-ray peak of the 55 kV case increased relatively slowly; its fast electron fraction was higher and the HXRs were stronger. Therefore, these may be electron-beam-generated x-rays.5,7–9,30,33 Considering that x-rays are emitted ∼1 ns after the first x-ray peak, the x-rays should be generated by the interaction between short-lived electron beams formed after neck disruption and hot dense plasma.5,7 In conclusion, the results of the first burst showed the typical dynamics of X-pinches.1,5,34,35

    The second bursts showed different characteristics from the first bursts, as shown in Figs. 18 and 19. The fast electron fractions increased to 15% and then fell to 1%. The electron density of the second burst rose to a level similar to that of the HS as the fast electron fractions increased, but the increase was much slower than that of the HS. After this, it quickly dropped below 1019 cm−3. Additionally, the electron temperature also increased slightly to more than 0.2 keV, but it remained low. Certain forms of L-shell radiation and recombination continuum radiation may be released weakly owing to the low temperature, which explains why channels 1, 4, and 5 produce almost similar signals in the second burst, as shown in Figs. 4 and 5. However, owing to the high fast electron fractions, the bremsstrahlung continuum and K-shell radiation were enhanced, resulting in strong signals in channels 6–10. The 50 and 55 kV cases exhibited similar temporal behavior, whereas the electron densities were estimated to be ∼10 times higher in the 55 kV case.

    Signals of channels 1, 2, and 10 and temporal evolution of estimated electron densities, electron temperatures, and fast electron fractions for the second burst of the 50 kV case.

    Figure 18.Signals of channels 1, 2, and 10 and temporal evolution of estimated electron densities, electron temperatures, and fast electron fractions for the second burst of the 50 kV case.

    Signals of channels 1, 2, and 10 and temporal evolution of estimated electron densities, electron temperatures, and fast electron fractions for the second burst of the 55 kV case.

    Figure 19.Signals of channels 1, 2, and 10 and temporal evolution of estimated electron densities, electron temperatures, and fast electron fractions for the second burst of the 55 kV case.

    However, in the third burst, similar plasma parameters were estimated in the 50 and 55 kV cases, as shown in Figs. 20 and 21, respectively. The electron temperatures were ∼0.1–0.2 keV, slightly lower than those of the second bursts. However, the electron densities and fast electron fractions were much smaller than those of the second burst. The electron density remained almost constant. The electron densities were ∼1018–1019 cm−3. The fast electron fractions also remained constant at ∼1%.

    Signals of channels 1, 2, and 10 and temporal evolution of estimated electron densities, electron temperatures, and fast electron fractions for the third burst of the 50 kV case.

    Figure 20.Signals of channels 1, 2, and 10 and temporal evolution of estimated electron densities, electron temperatures, and fast electron fractions for the third burst of the 50 kV case.

    Signals of channels 1, 2, and 10 and temporal evolution of estimated electron densities, electron temperatures, and fast electron fractions for the third burst of the 55 kV case.

    Figure 21.Signals of channels 1, 2, and 10 and temporal evolution of estimated electron densities, electron temperatures, and fast electron fractions for the third burst of the 55 kV case.

    The second and third bursts had a relatively high proportion of HXRs and were released for a longer time than the first burst; therefore, the formation of a long-lived electron beam was predicted. Moreover, the signals of channel 2 were clearly larger than those of channel 1, which indicates that strong radiation is emitted in the range of 0.9–3 keV. In this range, L-shell line radiation is emitted by the Cu plasma. Therefore, both bursts were inferred to be emitted by the interaction between the cold Cu plasma and long-lived electron beams. Previous studies have shown that after the neck structure has been completely depleted, the long-lived electron beams are accelerated between minidiodes; they interact with the anode of the minidiode and generate x-rays.5,7 However, unlike what was observed in previous studies, here they are divided into two bursts. This difference in behavior may occur because the energy for the acceleration of electrons at the third burst is not sufficient to generate intense electron beams and increase the electron density of the background plasma. However, we do not yet know the underlying mechanism that is involved here, and so further research is required.

    V. CONCLUSIONS

    Using a new spectroscopic method, we analyzed x-ray signals from the SNU X-pinch and revealed the temporal evolution of the plasma parameters. Three types of x-ray bursts were measured, and the conditions of plasma emission were analyzed. The electron density and temperature of the HS were estimated to be ∼1022–1023 cm−3 and 0.55–1 keV for the 50 kV case and ∼5 × 1023 cm−3 and 1.17 keV for the 55 kV case. In the 55 kV case, the x-ray peak from the short-lived electron beam was measured, at which the fast electron fraction increased to 5%. In general, it is known that a fast rise rate of current of greater than 1 kA/ns is required for the formation of a high-density HS by extreme compression in an X-pinch. The current rise rate of our pulse generator was ∼0.2 kA/ns, which falls short of this requirement. Therefore, it is likely that the plasma that was obtained close to the bright spot had a relatively large size of more than 10 µm and a low density of less than 1021 cm−3.1,20,30,35,36 However, the estimated plasma parameters were similar to those of high-density HSs.10,18,35 This may have resulted from the presence of plasmas with different conditions and from the influence of the plasma size. First, because our diagnostic system measures spatially integrated x-ray data, information on the various plasmas present within the X-pinch may have been collected. In particular, the high-energy electron component can increase the values of the estimated parameters, because it enhances the emission of bremsstrahlung and K-shell radiation.12 Moreover, owing to our method of analyzing a wide range of spectra, the influence of continuum and K-shell radiation is large. In addition, we considered electron beams, which are a type of high-energy electron component, but the lack of knowledge of their distribution results in uncertainty. For this reason, we estimated the effective plasma parameters. Second, the size of the plasma that determines the optical path length affects spectral calculations and plasma parameter estimations.11,19,26 This also results in uncertainty, because we do not know the exact plasma size. However, these factors do not change the trends of variation of the spectra obtained using the various plasma parameters, as shown in Figs. 10, 11, and 14. Moreover, the time evolution of the estimated HS parameters corresponds to typical X-pinch dynamics.1,5,34,35 Therefore, the estimated plasma parameters provided reasonable results as effective plasma parameters.

    We also revealed the temporal behavior of the plasma when long-lived electron beams were generated, which has not previously been reported. The second and third bursts by the long-lived electron beams are distinguished from the thermal x-ray burst emitted by the HS in that they have a slow rise time and low electron temperatures; the increase in electron density appears in the second burst, which is distinguished from the sharp increase in electron density due to HS formation. We infer that intense electron beams may reconnect the plasma channels in the X-pinch, which would have been disconnected after the main burst. The space where the electron beam accelerates is filled with plasmas that are ablated from the wires and diffused from the anode, as shown in the schlieren images of Christou et al.,37 who used a pulse generator with a current rise rate similar to ours. In addition, the current continued to increase after the pinch (270–320 ns). Thus, the formation of long-lived electron beams may increase the electron density in conjunction with a sufficient amount of material and current. This is similar to what occurs in the multiburst regime presented in a previous study.9 In this regime, the electron beam accelerates in the plasma gap and interacts with the remaining plasma. An increase in density then results from additional heating by the electron beam, which corresponds to the increase in electron density before 350 ns shown in Fig. 18 and before 312 ns shown in Fig. 19. A dense plasma channel is then once again formed and eventually collapses. In this process, plasmas with different parameters can exist in the space in which x-ray data is collected and can emit x-rays. Therefore, the spectrum estimated from the experimental results may be a combination of the spectra of the different plasma states such as dense plasma channels and low-density plasma with accelerated electron beams. However, more evidence is required to confirm the existence of this phenomenon, and spatial information about x-ray emissions must be considered. In particular, the area of x-ray emission by long-lived electron beams can increase to several millimeters in extent, while we assume that it is 1 mm in this study;5 the dense plasma channel should be smaller than this value. Therefore, we plan to investigate this using x-ray pinhole cameras and collimated x-ray diodes for the study of spatial information related to x-ray generation.

    The second and third bursts were generated after the main burst, and the number of x-ray bursts was increased. Therefore, the generation of a long-lived electron beam contributed to an increase in multibursts. Long-lived electron beams also have a significant influence on the energy of x-rays; they are the main source of HXRs. The yields of HXRs above 7 keV in the 50 and 55 kV cases were 11.2 and 32.9 mJ, respectively, and 79.3% and 75.8% of HXRs in the 50 and 55 kV cases were released from the second and third bursts, respectively. When the SNU X-pinch is utilized as an SXR source, the electron-beam-generated x-rays have negative effects, such as background emission by HXRs and lower temporal and spatial resolution.2,5 Therefore, to improve the SNU X-pinch as an SXR source, the second and third bursts should be weakened. However, long-lived electron-beam-generated x-rays can be utilized as an HXR source for x-ray radiography for targets requiring energetic x-rays.3,33 The yields of HXRs are also sufficient for x-ray radiography.2 Namely, the long-lived electron beam has both positive and negative effects when an X-pinch is used as an x-ray source. Therefore, the formation of a long-lived electron beam should be considered for optimization of X-pinches, depending on the purpose. Consequently, the formation of long-lived electron beams in the post-pinch process is an important factor not only in the dynamics of X-pinches, but also in their application. Therefore, we will conduct further research on the generation of long-lived electron beams in X-pinches, using additional diagnostics.

    ACKNOWLEDGMENTS

    Acknowledgment. This research was supported by the Defense Research Laboratory Program of the Defense Acquisition Program Administration and Agency for Defense Development of the Republic of Korea.

    References

    [1] S. A.Pikuz, A.Pikuz S., A.Shelkovenko T., D. and, T. A.Shelkovenko, A.Pikuz S., A.Shelkovenko T., D. and, D. A.Hammer. X-pinch. Part I. Plasma Phys. Rep., 41, 291(2015).

    [2] T. A.Shelkovenko, A.Shelkovenko T., A.Pikuz S., D. and, S. A.Pikuz, A.Shelkovenko T., A.Pikuz S., D. and, D. A.Hammer. A review of projection radiography of plasma and biological objects in X-pinch radiation. Plasma Phys. Rep., 42, 226(2016).

    [3] B. M.Song, M.Song B., A.Shelkovenko T., A.Pikuz S., A.Mitchell M., M.Chandler K., D. and, T. A.Shelkovenko, M.Song B., A.Shelkovenko T., A.Pikuz S., A.Mitchell M., M.Chandler K., D. and, S. A.Pikuz, M.Song B., A.Shelkovenko T., A.Pikuz S., A.Mitchell M., M.Chandler K., D. and, M. A.Mitchell, M.Song B., A.Shelkovenko T., A.Pikuz S., A.Mitchell M., M.Chandler K., D. and, K. M.Chandler, M.Song B., A.Shelkovenko T., A.Pikuz S., A.Mitchell M., M.Chandler K., D. and, D. A.Hammer. X pinch X-ray radiation above 8 keV for application to high-resolution radiography of biological specimens. IEEE Trans. Nucl. Sci., 51, 2514(2004).

    [4] T. A.Shelkovenko, A.Shelkovenko T., B.Sinars D., A.Pikuz S., D. and, D. B.Sinars, A.Shelkovenko T., B.Sinars D., A.Pikuz S., D. and, S. A.Pikuz, A.Shelkovenko T., B.Sinars D., A.Pikuz S., D. and, D. A.Hammer. Radiographic and spectroscopic studies of X-pinch plasma implosion dynamics and x-ray burst emission characteristics. Phys. Plasmas, 8, 1305(2001).

    [5] T. A.Shelkovenko, A.Shelkovenko T., A.Pikuz S., R.Mingaleev A., V.Agafonov A., M.Romanova V., E.Ter-Oganes’yan A., I.Tkachenko S., C.Blesener I., D.Mitchell M., M.Chandler K., R.Kusse B., D. and, S. A.Pikuz, A.Shelkovenko T., A.Pikuz S., R.Mingaleev A., V.Agafonov A., M.Romanova V., E.Ter-Oganes’yan A., I.Tkachenko S., C.Blesener I., D.Mitchell M., M.Chandler K., R.Kusse B., D. and, A. R.Mingaleev, A.Shelkovenko T., A.Pikuz S., R.Mingaleev A., V.Agafonov A., M.Romanova V., E.Ter-Oganes’yan A., I.Tkachenko S., C.Blesener I., D.Mitchell M., M.Chandler K., R.Kusse B., D. and, A. V.Agafonov, A.Shelkovenko T., A.Pikuz S., R.Mingaleev A., V.Agafonov A., M.Romanova V., E.Ter-Oganes’yan A., I.Tkachenko S., C.Blesener I., D.Mitchell M., M.Chandler K., R.Kusse B., D. and, V. M.Romanova, A.Shelkovenko T., A.Pikuz S., R.Mingaleev A., V.Agafonov A., M.Romanova V., E.Ter-Oganes’yan A., I.Tkachenko S., C.Blesener I., D.Mitchell M., M.Chandler K., R.Kusse B., D. and, A. E.Ter-Oganes’yan, A.Shelkovenko T., A.Pikuz S., R.Mingaleev A., V.Agafonov A., M.Romanova V., E.Ter-Oganes’yan A., I.Tkachenko S., C.Blesener I., D.Mitchell M., M.Chandler K., R.Kusse B., D. and, S. I.Tkachenko, A.Shelkovenko T., A.Pikuz S., R.Mingaleev A., V.Agafonov A., M.Romanova V., E.Ter-Oganes’yan A., I.Tkachenko S., C.Blesener I., D.Mitchell M., M.Chandler K., R.Kusse B., D. and, I. C.Blesener, A.Shelkovenko T., A.Pikuz S., R.Mingaleev A., V.Agafonov A., M.Romanova V., E.Ter-Oganes’yan A., I.Tkachenko S., C.Blesener I., D.Mitchell M., M.Chandler K., R.Kusse B., D. and, M. D.Mitchell, A.Shelkovenko T., A.Pikuz S., R.Mingaleev A., V.Agafonov A., M.Romanova V., E.Ter-Oganes’yan A., I.Tkachenko S., C.Blesener I., D.Mitchell M., M.Chandler K., R.Kusse B., D. and, K. M.Chandler, A.Shelkovenko T., A.Pikuz S., R.Mingaleev A., V.Agafonov A., M.Romanova V., E.Ter-Oganes’yan A., I.Tkachenko S., C.Blesener I., D.Mitchell M., M.Chandler K., R.Kusse B., D. and, B. R.Kusse, A.Shelkovenko T., A.Pikuz S., R.Mingaleev A., V.Agafonov A., M.Romanova V., E.Ter-Oganes’yan A., I.Tkachenko S., C.Blesener I., D.Mitchell M., M.Chandler K., R.Kusse B., D. and, D. A.Hammer. Accelerated electrons and hard X-ray emission from X-pinches. Plasma Phys. Rep., 34, 754(2008).

    [6] V. L.Kantsyrev, L.Kantsyrev V., A.Fedin D., S.Shlyaptseva A., S.Hansen, D.Chamberlain, N.Ouart and, D. A.Fedin, L.Kantsyrev V., A.Fedin D., S.Shlyaptseva A., S.Hansen, D.Chamberlain, N.Ouart and, A. S.Shlyaptseva, L.Kantsyrev V., A.Fedin D., S.Shlyaptseva A., S.Hansen, D.Chamberlain, N.Ouart and, S.Hansen, L.Kantsyrev V., A.Fedin D., S.Shlyaptseva A., S.Hansen, D.Chamberlain, N.Ouart and, D.Chamberlain, L.Kantsyrev V., A.Fedin D., S.Shlyaptseva A., S.Hansen, D.Chamberlain, N.Ouart and, N.Ouart. Energetic electron beam generation and anisotropy of hard x-ray emission from 0.9 to 1.0 MA high-Z X pinches. Phys. Plasmas, 10, 2519(2003).

    [7] T. A.Shelkovenko, A.Shelkovenko T., A.Pikuz S., M.Song B., M.Chandler K., D.Mitchell M., A.Hammer D., V.Ivanenkov G., R.Mingaleev A., V. and, S. A.Pikuz, A.Shelkovenko T., A.Pikuz S., M.Song B., M.Chandler K., D.Mitchell M., A.Hammer D., V.Ivanenkov G., R.Mingaleev A., V. and, B. M.Song, A.Shelkovenko T., A.Pikuz S., M.Song B., M.Chandler K., D.Mitchell M., A.Hammer D., V.Ivanenkov G., R.Mingaleev A., V. and, K. M.Chandler, A.Shelkovenko T., A.Pikuz S., M.Song B., M.Chandler K., D.Mitchell M., A.Hammer D., V.Ivanenkov G., R.Mingaleev A., V. and, M. D.Mitchell, A.Shelkovenko T., A.Pikuz S., M.Song B., M.Chandler K., D.Mitchell M., A.Hammer D., V.Ivanenkov G., R.Mingaleev A., V. and, D. A.Hammer, A.Shelkovenko T., A.Pikuz S., M.Song B., M.Chandler K., D.Mitchell M., A.Hammer D., V.Ivanenkov G., R.Mingaleev A., V. and, G. V.Ivanenkov, A.Shelkovenko T., A.Pikuz S., M.Song B., M.Chandler K., D.Mitchell M., A.Hammer D., V.Ivanenkov G., R.Mingaleev A., V. and, A. R.Mingaleev, A.Shelkovenko T., A.Pikuz S., M.Song B., M.Chandler K., D.Mitchell M., A.Hammer D., V.Ivanenkov G., R.Mingaleev A., V. and, V. M.Romanova. Electron-beam-generated x rays from X pinches. Phys. Plasmas, 12, 033102(2005).

    [8] V. L.Kantsyrev, L.Kantsyrev V., A.Fedin D., S.Shlyaptseva A., D.Mitchell M., M.Song B., A.Pikuz S., A.Shelkovenko T., M.Chandler K., A.Hammer D., L. and, D. A.Fedin, L.Kantsyrev V., A.Fedin D., S.Shlyaptseva A., D.Mitchell M., M.Song B., A.Pikuz S., A.Shelkovenko T., M.Chandler K., A.Hammer D., L. and, A. S.Shlyaptseva, L.Kantsyrev V., A.Fedin D., S.Shlyaptseva A., D.Mitchell M., M.Song B., A.Pikuz S., A.Shelkovenko T., M.Chandler K., A.Hammer D., L. and, M. D.Mitchell, L.Kantsyrev V., A.Fedin D., S.Shlyaptseva A., D.Mitchell M., M.Song B., A.Pikuz S., A.Shelkovenko T., M.Chandler K., A.Hammer D., L. and, B. M.Song, L.Kantsyrev V., A.Fedin D., S.Shlyaptseva A., D.Mitchell M., M.Song B., A.Pikuz S., A.Shelkovenko T., M.Chandler K., A.Hammer D., L. and, S. A.Pikuz, L.Kantsyrev V., A.Fedin D., S.Shlyaptseva A., D.Mitchell M., M.Song B., A.Pikuz S., A.Shelkovenko T., M.Chandler K., A.Hammer D., L. and, T. A.Shelkovenko, L.Kantsyrev V., A.Fedin D., S.Shlyaptseva A., D.Mitchell M., M.Song B., A.Pikuz S., A.Shelkovenko T., M.Chandler K., A.Hammer D., L. and, K. M.Chandler, L.Kantsyrev V., A.Fedin D., S.Shlyaptseva A., D.Mitchell M., M.Song B., A.Pikuz S., A.Shelkovenko T., M.Chandler K., A.Hammer D., L. and, D. A.Hammer, L.Kantsyrev V., A.Fedin D., S.Shlyaptseva A., D.Mitchell M., M.Song B., A.Pikuz S., A.Shelkovenko T., M.Chandler K., A.Hammer D., L. and, L. M.Maxson. Studies of energetic electrons with space and time resolution in Mo and W X-pinches from measurements of x rays >9 keV. Rev. Sci. Instrum, 75, 3708(2004).

    [9] V.Kantsyrev, V.Kantsyrev, A.Safronova, V.Ivanov, D.Fedin, R.Mancini, A.Astanovitsky, B.LeGalloudec, S.Batie, D.Brown, V.Nalajala, I.Shrestha, S.Pokala, N.Ouart, F.Yilmaz, A.Clinton, M.Johnson, T.Cowan, B.Jones, A.Coverdale C., C.Deeney, D.LePell P., D.Jobe, D.Nielson and, A.Safronova, V.Kantsyrev, A.Safronova, V.Ivanov, D.Fedin, R.Mancini, A.Astanovitsky, B.LeGalloudec, S.Batie, D.Brown, V.Nalajala, I.Shrestha, S.Pokala, N.Ouart, F.Yilmaz, A.Clinton, M.Johnson, T.Cowan, B.Jones, A.Coverdale C., C.Deeney, D.LePell P., D.Jobe, D.Nielson and, V.Ivanov, V.Kantsyrev, A.Safronova, V.Ivanov, D.Fedin, R.Mancini, A.Astanovitsky, B.LeGalloudec, S.Batie, D.Brown, V.Nalajala, I.Shrestha, S.Pokala, N.Ouart, F.Yilmaz, A.Clinton, M.Johnson, T.Cowan, B.Jones, A.Coverdale C., C.Deeney, D.LePell P., D.Jobe, D.Nielson and, D.Fedin, V.Kantsyrev, A.Safronova, V.Ivanov, D.Fedin, R.Mancini, A.Astanovitsky, B.LeGalloudec, S.Batie, D.Brown, V.Nalajala, I.Shrestha, S.Pokala, N.Ouart, F.Yilmaz, A.Clinton, M.Johnson, T.Cowan, B.Jones, A.Coverdale C., C.Deeney, D.LePell P., D.Jobe, D.Nielson and, R.Mancini, V.Kantsyrev, A.Safronova, V.Ivanov, D.Fedin, R.Mancini, A.Astanovitsky, B.LeGalloudec, S.Batie, D.Brown, V.Nalajala, I.Shrestha, S.Pokala, N.Ouart, F.Yilmaz, A.Clinton, M.Johnson, T.Cowan, B.Jones, A.Coverdale C., C.Deeney, D.LePell P., D.Jobe, D.Nielson and, A.Astanovitsky, V.Kantsyrev, A.Safronova, V.Ivanov, D.Fedin, R.Mancini, A.Astanovitsky, B.LeGalloudec, S.Batie, D.Brown, V.Nalajala, I.Shrestha, S.Pokala, N.Ouart, F.Yilmaz, A.Clinton, M.Johnson, T.Cowan, B.Jones, A.Coverdale C., C.Deeney, D.LePell P., D.Jobe, D.Nielson and, B.LeGalloudec, V.Kantsyrev, A.Safronova, V.Ivanov, D.Fedin, R.Mancini, A.Astanovitsky, B.LeGalloudec, S.Batie, D.Brown, V.Nalajala, I.Shrestha, S.Pokala, N.Ouart, F.Yilmaz, A.Clinton, M.Johnson, T.Cowan, B.Jones, A.Coverdale C., C.Deeney, D.LePell P., D.Jobe, D.Nielson and, S.Batie, V.Kantsyrev, A.Safronova, V.Ivanov, D.Fedin, R.Mancini, A.Astanovitsky, B.LeGalloudec, S.Batie, D.Brown, V.Nalajala, I.Shrestha, S.Pokala, N.Ouart, F.Yilmaz, A.Clinton, M.Johnson, T.Cowan, B.Jones, A.Coverdale C., C.Deeney, D.LePell P., D.Jobe, D.Nielson and, D.Brown, V.Kantsyrev, A.Safronova, V.Ivanov, D.Fedin, R.Mancini, A.Astanovitsky, B.LeGalloudec, S.Batie, D.Brown, V.Nalajala, I.Shrestha, S.Pokala, N.Ouart, F.Yilmaz, A.Clinton, M.Johnson, T.Cowan, B.Jones, A.Coverdale C., C.Deeney, D.LePell P., D.Jobe, D.Nielson and, V.Nalajala, V.Kantsyrev, A.Safronova, V.Ivanov, D.Fedin, R.Mancini, A.Astanovitsky, B.LeGalloudec, S.Batie, D.Brown, V.Nalajala, I.Shrestha, S.Pokala, N.Ouart, F.Yilmaz, A.Clinton, M.Johnson, T.Cowan, B.Jones, A.Coverdale C., C.Deeney, D.LePell P., D.Jobe, D.Nielson and, I.Shrestha, V.Kantsyrev, A.Safronova, V.Ivanov, D.Fedin, R.Mancini, A.Astanovitsky, B.LeGalloudec, S.Batie, D.Brown, V.Nalajala, I.Shrestha, S.Pokala, N.Ouart, F.Yilmaz, A.Clinton, M.Johnson, T.Cowan, B.Jones, A.Coverdale C., C.Deeney, D.LePell P., D.Jobe, D.Nielson and, S.Pokala, V.Kantsyrev, A.Safronova, V.Ivanov, D.Fedin, R.Mancini, A.Astanovitsky, B.LeGalloudec, S.Batie, D.Brown, V.Nalajala, I.Shrestha, S.Pokala, N.Ouart, F.Yilmaz, A.Clinton, M.Johnson, T.Cowan, B.Jones, A.Coverdale C., C.Deeney, D.LePell P., D.Jobe, D.Nielson and, N.Ouart, V.Kantsyrev, A.Safronova, V.Ivanov, D.Fedin, R.Mancini, A.Astanovitsky, B.LeGalloudec, S.Batie, D.Brown, V.Nalajala, I.Shrestha, S.Pokala, N.Ouart, F.Yilmaz, A.Clinton, M.Johnson, T.Cowan, B.Jones, A.Coverdale C., C.Deeney, D.LePell P., D.Jobe, D.Nielson and, F.Yilmaz, V.Kantsyrev, A.Safronova, V.Ivanov, D.Fedin, R.Mancini, A.Astanovitsky, B.LeGalloudec, S.Batie, D.Brown, V.Nalajala, I.Shrestha, S.Pokala, N.Ouart, F.Yilmaz, A.Clinton, M.Johnson, T.Cowan, B.Jones, A.Coverdale C., C.Deeney, D.LePell P., D.Jobe, D.Nielson and, A.Clinton, V.Kantsyrev, A.Safronova, V.Ivanov, D.Fedin, R.Mancini, A.Astanovitsky, B.LeGalloudec, S.Batie, D.Brown, V.Nalajala, I.Shrestha, S.Pokala, N.Ouart, F.Yilmaz, A.Clinton, M.Johnson, T.Cowan, B.Jones, A.Coverdale C., C.Deeney, D.LePell P., D.Jobe, D.Nielson and, M.Johnson, V.Kantsyrev, A.Safronova, V.Ivanov, D.Fedin, R.Mancini, A.Astanovitsky, B.LeGalloudec, S.Batie, D.Brown, V.Nalajala, I.Shrestha, S.Pokala, N.Ouart, F.Yilmaz, A.Clinton, M.Johnson, T.Cowan, B.Jones, A.Coverdale C., C.Deeney, D.LePell P., D.Jobe, D.Nielson and, T.Cowan, V.Kantsyrev, A.Safronova, V.Ivanov, D.Fedin, R.Mancini, A.Astanovitsky, B.LeGalloudec, S.Batie, D.Brown, V.Nalajala, I.Shrestha, S.Pokala, N.Ouart, F.Yilmaz, A.Clinton, M.Johnson, T.Cowan, B.Jones, A.Coverdale C., C.Deeney, D.LePell P., D.Jobe, D.Nielson and, B.Jones, V.Kantsyrev, A.Safronova, V.Ivanov, D.Fedin, R.Mancini, A.Astanovitsky, B.LeGalloudec, S.Batie, D.Brown, V.Nalajala, I.Shrestha, S.Pokala, N.Ouart, F.Yilmaz, A.Clinton, M.Johnson, T.Cowan, B.Jones, A.Coverdale C., C.Deeney, D.LePell P., D.Jobe, D.Nielson and, C. A.Coverdale, V.Kantsyrev, A.Safronova, V.Ivanov, D.Fedin, R.Mancini, A.Astanovitsky, B.LeGalloudec, S.Batie, D.Brown, V.Nalajala, I.Shrestha, S.Pokala, N.Ouart, F.Yilmaz, A.Clinton, M.Johnson, T.Cowan, B.Jones, A.Coverdale C., C.Deeney, D.LePell P., D.Jobe, D.Nielson and, C.Deeney, V.Kantsyrev, A.Safronova, V.Ivanov, D.Fedin, R.Mancini, A.Astanovitsky, B.LeGalloudec, S.Batie, D.Brown, V.Nalajala, I.Shrestha, S.Pokala, N.Ouart, F.Yilmaz, A.Clinton, M.Johnson, T.Cowan, B.Jones, A.Coverdale C., C.Deeney, D.LePell P., D.Jobe, D.Nielson and, P. D.LePell, V.Kantsyrev, A.Safronova, V.Ivanov, D.Fedin, R.Mancini, A.Astanovitsky, B.LeGalloudec, S.Batie, D.Brown, V.Nalajala, I.Shrestha, S.Pokala, N.Ouart, F.Yilmaz, A.Clinton, M.Johnson, T.Cowan, B.Jones, A.Coverdale C., C.Deeney, D.LePell P., D.Jobe, D.Nielson and, D.Jobe, V.Kantsyrev, A.Safronova, V.Ivanov, D.Fedin, R.Mancini, A.Astanovitsky, B.LeGalloudec, S.Batie, D.Brown, V.Nalajala, I.Shrestha, S.Pokala, N.Ouart, F.Yilmaz, A.Clinton, M.Johnson, T.Cowan, B.Jones, A.Coverdale C., C.Deeney, D.LePell P., D.Jobe, D.Nielson and, D.Nielson. Radiative properties of asymmetric and symmetric X-pinches with two and four wires recently produced on the UNR 1 MA Zebra generator. J. Quant. Spectrosc. Radiat. Transfer, 99, 349(2006).

    [10] A. S.Shlyaptseva, S.Shlyaptseva A., B.Hansen S., L.Kantsyrev V., A.Fedin D., N.Ouart, B.Fournier K., U. and, S. B.Hansen, S.Shlyaptseva A., B.Hansen S., L.Kantsyrev V., A.Fedin D., N.Ouart, B.Fournier K., U. and, V. L.Kantsyrev, S.Shlyaptseva A., B.Hansen S., L.Kantsyrev V., A.Fedin D., N.Ouart, B.Fournier K., U. and, D. A.Fedin, S.Shlyaptseva A., B.Hansen S., L.Kantsyrev V., A.Fedin D., N.Ouart, B.Fournier K., U. and, N.Ouart, S.Shlyaptseva A., B.Hansen S., L.Kantsyrev V., A.Fedin D., N.Ouart, B.Fournier K., U. and, K. B.Fournier, S.Shlyaptseva A., B.Hansen S., L.Kantsyrev V., A.Fedin D., N.Ouart, B.Fournier K., U. and, U. I.Safronova. Advanced spectroscopic analysis of 0.8–1.0-MA Mo x pinches and the influence of plasma electron beams on L-shell spectra of Mo ions. Phys. Rev. E, 67, 026409(2003).

    [11] G. W.Collins, W.Collins G., P.Valdivia M., B.Hansen S., F.Conti, C.Carlson L., A.Hammer D., A.Elshafiey, J.Narkis, F. and, M. P.Valdivia, W.Collins G., P.Valdivia M., B.Hansen S., F.Conti, C.Carlson L., A.Hammer D., A.Elshafiey, J.Narkis, F. and, S. B.Hansen, W.Collins G., P.Valdivia M., B.Hansen S., F.Conti, C.Carlson L., A.Hammer D., A.Elshafiey, J.Narkis, F. and, F.Conti, W.Collins G., P.Valdivia M., B.Hansen S., F.Conti, C.Carlson L., A.Hammer D., A.Elshafiey, J.Narkis, F. and, L. C.Carlson, W.Collins G., P.Valdivia M., B.Hansen S., F.Conti, C.Carlson L., A.Hammer D., A.Elshafiey, J.Narkis, F. and, D. A.Hammer, W.Collins G., P.Valdivia M., B.Hansen S., F.Conti, C.Carlson L., A.Hammer D., A.Elshafiey, J.Narkis, F. and, A.Elshafiey, W.Collins G., P.Valdivia M., B.Hansen S., F.Conti, C.Carlson L., A.Hammer D., A.Elshafiey, J.Narkis, F. and, J.Narkis, W.Collins G., P.Valdivia M., B.Hansen S., F.Conti, C.Carlson L., A.Hammer D., A.Elshafiey, J.Narkis, F. and, F. N.Beg. Direct comparison of wire, foil, and hybrid X-pinches on a 200 kA, 150 ns current driver. J. Appl. Phys., 129, 073301(2021).

    [12] S. B.Hansen, B.Hansen S., A. S.Shlyaptseva. Effects of the electron energy distribution function on modeled x-ray spectra. Phys. Rev. E, 70, 036402(2004).

    [13] S. A.Pikuz, A.Pikuz S., A.Shelkovenko T., M.Ramanova V., J.Abdallah, Jr., G.Csanak, E. R., Y.Faenov A., Y.Skobelev I., D. and, T. A.Shelkovenko, A.Pikuz S., A.Shelkovenko T., M.Ramanova V., J.Abdallah, Jr., G.Csanak, E. R., Y.Faenov A., Y.Skobelev I., D. and, V. M.Ramanova, A.Pikuz S., A.Shelkovenko T., M.Ramanova V., J.Abdallah, Jr., G.Csanak, E. R., Y.Faenov A., Y.Skobelev I., D. and, J. Abdallah, A.Pikuz S., A.Shelkovenko T., M.Ramanova V., J.Abdallah, Jr., G.Csanak, E. R., Y.Faenov A., Y.Skobelev I., D. and, G.Csanak, A.Pikuz S., A.Shelkovenko T., M.Ramanova V., J.Abdallah, Jr., G.Csanak, E. R., Y.Faenov A., Y.Skobelev I., D. and, R. E. H.Clark, A.Pikuz S., A.Shelkovenko T., M.Ramanova V., J.Abdallah, Jr., G.Csanak, E. R., Y.Faenov A., Y.Skobelev I., D. and, A. Y.Faenov, A.Pikuz S., A.Shelkovenko T., M.Ramanova V., J.Abdallah, Jr., G.Csanak, E. R., Y.Faenov A., Y.Skobelev I., D. and, I. Y.Skobelev, A.Pikuz S., A.Shelkovenko T., M.Ramanova V., J.Abdallah, Jr., G.Csanak, E. R., Y.Faenov A., Y.Skobelev I., D. and, D. A.Hammer. Effect of an electron beam generated in an X-pinch plasma on the structure of the K spectra of multiply charged ions. J. Exp. Theor. Phys., 85, 484(1997).

    [14] S.Ham, S.Ham, J.Ryu, S.Park, K.-J.Chung, Y.-C.Ghim, J.Woo H., Y. and, J.Ryu, S.Ham, J.Ryu, S.Park, K.-J.Chung, Y.-C.Ghim, J.Woo H., Y. and, S.Park, S.Ham, J.Ryu, S.Park, K.-J.Chung, Y.-C.Ghim, J.Woo H., Y. and, K.-J.Chung, S.Ham, J.Ryu, S.Park, K.-J.Chung, Y.-C.Ghim, J.Woo H., Y. and, Y.-C.Ghim, S.Ham, J.Ryu, S.Park, K.-J.Chung, Y.-C.Ghim, J.Woo H., Y. and, H. J.Woo, S.Ham, J.Ryu, S.Park, K.-J.Chung, Y.-C.Ghim, J.Woo H., Y. and, Y. S.Hwang. Development of a filtered AXUV diode array for X-pinch soft x-ray spectra in the energy range of 1–10 keV. Rev. Sci. Instrum., 92, 053509(2021).

    [15] J.Ryu, J.Ryu, S.Ham, J.Lee, J.Park, S.Park, Y.Choi, J.Woo H., K.Lee, Y.-C.Ghim, S.Hwang Y., K.-J.Chung and, S.Ham, J.Ryu, S.Ham, J.Lee, J.Park, S.Park, Y.Choi, J.Woo H., K.Lee, Y.-C.Ghim, S.Hwang Y., K.-J.Chung and, J.Lee, J.Ryu, S.Ham, J.Lee, J.Park, S.Park, Y.Choi, J.Woo H., K.Lee, Y.-C.Ghim, S.Hwang Y., K.-J.Chung and, J.Park, J.Ryu, S.Ham, J.Lee, J.Park, S.Park, Y.Choi, J.Woo H., K.Lee, Y.-C.Ghim, S.Hwang Y., K.-J.Chung and, S.Park, J.Ryu, S.Ham, J.Lee, J.Park, S.Park, Y.Choi, J.Woo H., K.Lee, Y.-C.Ghim, S.Hwang Y., K.-J.Chung and, Y.Choi, J.Ryu, S.Ham, J.Lee, J.Park, S.Park, Y.Choi, J.Woo H., K.Lee, Y.-C.Ghim, S.Hwang Y., K.-J.Chung and, H. J.Woo, J.Ryu, S.Ham, J.Lee, J.Park, S.Park, Y.Choi, J.Woo H., K.Lee, Y.-C.Ghim, S.Hwang Y., K.-J.Chung and, K.Lee, J.Ryu, S.Ham, J.Lee, J.Park, S.Park, Y.Choi, J.Woo H., K.Lee, Y.-C.Ghim, S.Hwang Y., K.-J.Chung and, Y.-C.Ghim, J.Ryu, S.Ham, J.Lee, J.Park, S.Park, Y.Choi, J.Woo H., K.Lee, Y.-C.Ghim, S.Hwang Y., K.-J.Chung and, Y. S.Hwang, J.Ryu, S.Ham, J.Lee, J.Park, S.Park, Y.Choi, J.Woo H., K.Lee, Y.-C.Ghim, S.Hwang Y., K.-J.Chung and, K.-J.Chung. A modular X-pinch device for versatile X-pinch experiments at Seoul National University. Rev. Sci. Instrum., 92, 053533(2021).

    [16] D. L.Fehl, L.Fehl D., A.Stygar W., A.Chandler G., E.Cuneo M., C. and, W. A.Stygar, L.Fehl D., A.Stygar W., A.Chandler G., E.Cuneo M., C. and, G. A.Chandler, L.Fehl D., A.Stygar W., A.Chandler G., E.Cuneo M., C. and, M. E.Cuneo, L.Fehl D., A.Stygar W., A.Chandler G., E.Cuneo M., C. and, C. L.Ruiz. X-ray flux from filtered arrays of detectors without unfolding. Rev. Sci. Instrum., 76, 103504(2005).

    [17] S.Tianming, S.Tianming, Y.Jiamin, Y.Rongqing and, Y.Jiamin, S.Tianming, Y.Jiamin, Y.Rongqing and, Y.Rongqing. Recover soft x-ray spectrum using virtual flat response channels with filtered x-ray diode array. Rev. Sci. Instrum., 83, 113102(2012).

    [18] S. A.Pikuz, A.Pikuz S., A.Shelkovenko T., M.Chandler K., D.Mitchell M., A.Hammer D., Y.Skobelev I., S.Shlyaptseva A., S. and, T. A.Shelkovenko, A.Pikuz S., A.Shelkovenko T., M.Chandler K., D.Mitchell M., A.Hammer D., Y.Skobelev I., S.Shlyaptseva A., S. and, K. M.Chandler, A.Pikuz S., A.Shelkovenko T., M.Chandler K., D.Mitchell M., A.Hammer D., Y.Skobelev I., S.Shlyaptseva A., S. and, M. D.Mitchell, A.Pikuz S., A.Shelkovenko T., M.Chandler K., D.Mitchell M., A.Hammer D., Y.Skobelev I., S.Shlyaptseva A., S. and, D. A.Hammer, A.Pikuz S., A.Shelkovenko T., M.Chandler K., D.Mitchell M., A.Hammer D., Y.Skobelev I., S.Shlyaptseva A., S. and, I. Y.Skobelev, A.Pikuz S., A.Shelkovenko T., M.Chandler K., D.Mitchell M., A.Hammer D., Y.Skobelev I., S.Shlyaptseva A., S. and, A. S.Shlyaptseva, A.Pikuz S., A.Shelkovenko T., M.Chandler K., D.Mitchell M., A.Hammer D., Y.Skobelev I., S.Shlyaptseva A., S. and, S. B.Hansen. X-ray spectroscopy for high energy-density X pinch density and temperature measurements (invited). Rev. Sci. Instrum., 75, 3666(2004).

    [19] D. B.Sinars, B.Sinars D., A.Pikuz S., A.Shelkovenko T., M.Chandler K., A.Hammer D., J. and, S. A.Pikuz, B.Sinars D., A.Pikuz S., A.Shelkovenko T., M.Chandler K., A.Hammer D., J. and, T. A.Shelkovenko, B.Sinars D., A.Pikuz S., A.Shelkovenko T., M.Chandler K., A.Hammer D., J. and, K. M.Chandler, B.Sinars D., A.Pikuz S., A.Shelkovenko T., M.Chandler K., A.Hammer D., J. and, D. A.Hammer, B.Sinars D., A.Pikuz S., A.Shelkovenko T., M.Chandler K., A.Hammer D., J. and, J. P.Apruzese. Time-resolved spectroscopy of Al, Ti, and Mo X pinch radiation using an X-ray streak camera. J. Quant. Spectrosc. Radiat. Transfer, 78, 61(2003).

    [20] T. A.Shelkovenko, A.Shelkovenko T., A.Pikuz S., N.Tilikin I., A.Elshafiey, D. and, S. A.Pikuz, A.Shelkovenko T., A.Pikuz S., N.Tilikin I., A.Elshafiey, D. and, I. N.Tilikin, A.Shelkovenko T., A.Pikuz S., N.Tilikin I., A.Elshafiey, D. and, A.Elshafiey, A.Shelkovenko T., A.Pikuz S., N.Tilikin I., A.Elshafiey, D. and, D. A.Hammer. Time-resolved investigation of subnanosecond radiation from Al wire hybrid X pinches. Phys. Rev. E, 102, 063208(2020).

    [21] T. A.Shelkovenko, A.Shelkovenko T., A.Pikuz S., B.Sinars D., M.Chandler K., D. and, S. A.Pikuz, A.Shelkovenko T., A.Pikuz S., B.Sinars D., M.Chandler K., D. and, D. B.Sinars, A.Shelkovenko T., A.Pikuz S., B.Sinars D., M.Chandler K., D. and, K. M.Chandler, A.Shelkovenko T., A.Pikuz S., B.Sinars D., M.Chandler K., D. and, D. A.Hammer. Time-resolved spectroscopic measurements of ∼1 keV, dense, subnanosecond X-pinch plasma bright spots. Phys. Plasmas, 9, 2165(2002).

    [22] S. A.Pikuz, A.Pikuz S., B.Sinars D., A.Shelkovenko T., M.Chandler K., A.Hammer D., V.Ivanenkov G., W.Stepniewski, I. and, D. B.Sinars, A.Pikuz S., B.Sinars D., A.Shelkovenko T., M.Chandler K., A.Hammer D., V.Ivanenkov G., W.Stepniewski, I. and, T. A.Shelkovenko, A.Pikuz S., B.Sinars D., A.Shelkovenko T., M.Chandler K., A.Hammer D., V.Ivanenkov G., W.Stepniewski, I. and, K. M.Chandler, A.Pikuz S., B.Sinars D., A.Shelkovenko T., M.Chandler K., A.Hammer D., V.Ivanenkov G., W.Stepniewski, I. and, D. A.Hammer, A.Pikuz S., B.Sinars D., A.Shelkovenko T., M.Chandler K., A.Hammer D., V.Ivanenkov G., W.Stepniewski, I. and, G. V.Ivanenkov, A.Pikuz S., B.Sinars D., A.Shelkovenko T., M.Chandler K., A.Hammer D., V.Ivanenkov G., W.Stepniewski, I. and, W.Stepniewski, A.Pikuz S., B.Sinars D., A.Shelkovenko T., M.Chandler K., A.Hammer D., V.Ivanenkov G., W.Stepniewski, I. and, I. Y.Skobelev. High energy density Z-pinch plasma conditions with picosecond time resolution. Phys. Rev. Lett., 89, 035003(2002).

    [23] H.-K.Chung, H.-K.Chung, H.Chen M., L.Morgan W., Y.Ralchenko, R. and, M. H.Chen, H.-K.Chung, H.Chen M., L.Morgan W., Y.Ralchenko, R. and, W. L.Morgan, H.-K.Chung, H.Chen M., L.Morgan W., Y.Ralchenko, R. and, Y.Ralchenko, H.-K.Chung, H.Chen M., L.Morgan W., Y.Ralchenko, R. and, R. W.Lee. FLYCHK: Generalized population kinetics and spectral model for rapid spectroscopic analysis for all elements. High Energy Density Phys., 1, 3(2005).

    [24] M. S.Cho, S.Cho M., H.Sohn J., H.-K.Chung, I.Cho B., S. and, J. H.Sohn, S.Cho M., H.Sohn J., H.-K.Chung, I.Cho B., S. and, H.-K.Chung, S.Cho M., H.Sohn J., H.-K.Chung, I.Cho B., S. and, B. I.Cho, S.Cho M., H.Sohn J., H.-K.Chung, I.Cho B., S. and, S. J.Hahn. Analysis on the FLYCHK opacity of X-pinch wire materials. J. Korean Phys. Soc., 78, 1072(2021).

    [25] A.Bar-Shalom, A.Bar-Shalom, M.Klapisch, J.Oreg and, M.Klapisch, A.Bar-Shalom, M.Klapisch, J.Oreg and, J.Oreg. HULLAC, an integrated computer package for atomic processes in plasmas. J. Quant. Spectrosc. Radiat. Transfer, 71, 169(2001).

    [26] H.-K.Chung, H.-K.Chung, R.Lee, M.Chen, Y.Ralchenko and, R.Lee, H.-K.Chung, R.Lee, M.Chen, Y.Ralchenko and, M.Chen, H.-K.Chung, R.Lee, M.Chen, Y.Ralchenko and, Y.Ralchenko(2008).

    [27] C. M.Huntington, M.Huntington C., C.Kuranz C., G.Malamud, P.Drake R., H.-S.Park, B. and, C. C.Kuranz, M.Huntington C., C.Kuranz C., G.Malamud, P.Drake R., H.-S.Park, B. and, G.Malamud, M.Huntington C., C.Kuranz C., G.Malamud, P.Drake R., H.-S.Park, B. and, R. P.Drake, M.Huntington C., C.Kuranz C., G.Malamud, P.Drake R., H.-S.Park, B. and, H.-S.Park, M.Huntington C., C.Kuranz C., G.Malamud, P.Drake R., H.-S.Park, B. and, B. R.Maddox. Spectral analysis of x-ray emission created by intense laser irradiation of copper materials. Rev. Sci. Instrum., 83, 10E114(2012).

    [28] M.?míd, M.?míd, O.Renner, B.Rosmej F., D.Khaghani and, O.Renner, M.?míd, O.Renner, B.Rosmej F., D.Khaghani and, F. B.Rosmej, M.?míd, O.Renner, B.Rosmej F., D.Khaghani and, D.Khaghani. Investigation of x-ray emission induced by hot electrons in dense Cu plasmas. Phys. Scr., 2014, 014020.

    [29] K. U.Akli, U.Akli K., H.Key M., K.Chung H., B.Hansen S., R.Freeman R., H.Chen M., G.Gregori, S.Hatchett, D.Hey, N.Izumi, J.King, J.Kuba, P.Norreys, J.Mackinnon A., D.Murphy C., R.Snavely, B.Stephens R., C.Stoeckel, W.Theobald, B.Zhang and, M. H.Key, U.Akli K., H.Key M., K.Chung H., B.Hansen S., R.Freeman R., H.Chen M., G.Gregori, S.Hatchett, D.Hey, N.Izumi, J.King, J.Kuba, P.Norreys, J.Mackinnon A., D.Murphy C., R.Snavely, B.Stephens R., C.Stoeckel, W.Theobald, B.Zhang and, H. K.Chung, U.Akli K., H.Key M., K.Chung H., B.Hansen S., R.Freeman R., H.Chen M., G.Gregori, S.Hatchett, D.Hey, N.Izumi, J.King, J.Kuba, P.Norreys, J.Mackinnon A., D.Murphy C., R.Snavely, B.Stephens R., C.Stoeckel, W.Theobald, B.Zhang and, S. B.Hansen, U.Akli K., H.Key M., K.Chung H., B.Hansen S., R.Freeman R., H.Chen M., G.Gregori, S.Hatchett, D.Hey, N.Izumi, J.King, J.Kuba, P.Norreys, J.Mackinnon A., D.Murphy C., R.Snavely, B.Stephens R., C.Stoeckel, W.Theobald, B.Zhang and, R. R.Freeman, U.Akli K., H.Key M., K.Chung H., B.Hansen S., R.Freeman R., H.Chen M., G.Gregori, S.Hatchett, D.Hey, N.Izumi, J.King, J.Kuba, P.Norreys, J.Mackinnon A., D.Murphy C., R.Snavely, B.Stephens R., C.Stoeckel, W.Theobald, B.Zhang and, M. H.Chen, U.Akli K., H.Key M., K.Chung H., B.Hansen S., R.Freeman R., H.Chen M., G.Gregori, S.Hatchett, D.Hey, N.Izumi, J.King, J.Kuba, P.Norreys, J.Mackinnon A., D.Murphy C., R.Snavely, B.Stephens R., C.Stoeckel, W.Theobald, B.Zhang and, G.Gregori, U.Akli K., H.Key M., K.Chung H., B.Hansen S., R.Freeman R., H.Chen M., G.Gregori, S.Hatchett, D.Hey, N.Izumi, J.King, J.Kuba, P.Norreys, J.Mackinnon A., D.Murphy C., R.Snavely, B.Stephens R., C.Stoeckel, W.Theobald, B.Zhang and, S.Hatchett, U.Akli K., H.Key M., K.Chung H., B.Hansen S., R.Freeman R., H.Chen M., G.Gregori, S.Hatchett, D.Hey, N.Izumi, J.King, J.Kuba, P.Norreys, J.Mackinnon A., D.Murphy C., R.Snavely, B.Stephens R., C.Stoeckel, W.Theobald, B.Zhang and, D.Hey, U.Akli K., H.Key M., K.Chung H., B.Hansen S., R.Freeman R., H.Chen M., G.Gregori, S.Hatchett, D.Hey, N.Izumi, J.King, J.Kuba, P.Norreys, J.Mackinnon A., D.Murphy C., R.Snavely, B.Stephens R., C.Stoeckel, W.Theobald, B.Zhang and, N.Izumi, U.Akli K., H.Key M., K.Chung H., B.Hansen S., R.Freeman R., H.Chen M., G.Gregori, S.Hatchett, D.Hey, N.Izumi, J.King, J.Kuba, P.Norreys, J.Mackinnon A., D.Murphy C., R.Snavely, B.Stephens R., C.Stoeckel, W.Theobald, B.Zhang and, J.King, U.Akli K., H.Key M., K.Chung H., B.Hansen S., R.Freeman R., H.Chen M., G.Gregori, S.Hatchett, D.Hey, N.Izumi, J.King, J.Kuba, P.Norreys, J.Mackinnon A., D.Murphy C., R.Snavely, B.Stephens R., C.Stoeckel, W.Theobald, B.Zhang and, J.Kuba, U.Akli K., H.Key M., K.Chung H., B.Hansen S., R.Freeman R., H.Chen M., G.Gregori, S.Hatchett, D.Hey, N.Izumi, J.King, J.Kuba, P.Norreys, J.Mackinnon A., D.Murphy C., R.Snavely, B.Stephens R., C.Stoeckel, W.Theobald, B.Zhang and, P.Norreys, U.Akli K., H.Key M., K.Chung H., B.Hansen S., R.Freeman R., H.Chen M., G.Gregori, S.Hatchett, D.Hey, N.Izumi, J.King, J.Kuba, P.Norreys, J.Mackinnon A., D.Murphy C., R.Snavely, B.Stephens R., C.Stoeckel, W.Theobald, B.Zhang and, A. J.Mackinnon, U.Akli K., H.Key M., K.Chung H., B.Hansen S., R.Freeman R., H.Chen M., G.Gregori, S.Hatchett, D.Hey, N.Izumi, J.King, J.Kuba, P.Norreys, J.Mackinnon A., D.Murphy C., R.Snavely, B.Stephens R., C.Stoeckel, W.Theobald, B.Zhang and, C. D.Murphy, U.Akli K., H.Key M., K.Chung H., B.Hansen S., R.Freeman R., H.Chen M., G.Gregori, S.Hatchett, D.Hey, N.Izumi, J.King, J.Kuba, P.Norreys, J.Mackinnon A., D.Murphy C., R.Snavely, B.Stephens R., C.Stoeckel, W.Theobald, B.Zhang and, R.Snavely, U.Akli K., H.Key M., K.Chung H., B.Hansen S., R.Freeman R., H.Chen M., G.Gregori, S.Hatchett, D.Hey, N.Izumi, J.King, J.Kuba, P.Norreys, J.Mackinnon A., D.Murphy C., R.Snavely, B.Stephens R., C.Stoeckel, W.Theobald, B.Zhang and, R. B.Stephens, U.Akli K., H.Key M., K.Chung H., B.Hansen S., R.Freeman R., H.Chen M., G.Gregori, S.Hatchett, D.Hey, N.Izumi, J.King, J.Kuba, P.Norreys, J.Mackinnon A., D.Murphy C., R.Snavely, B.Stephens R., C.Stoeckel, W.Theobald, B.Zhang and, C.Stoeckel, U.Akli K., H.Key M., K.Chung H., B.Hansen S., R.Freeman R., H.Chen M., G.Gregori, S.Hatchett, D.Hey, N.Izumi, J.King, J.Kuba, P.Norreys, J.Mackinnon A., D.Murphy C., R.Snavely, B.Stephens R., C.Stoeckel, W.Theobald, B.Zhang and, W.Theobald, U.Akli K., H.Key M., K.Chung H., B.Hansen S., R.Freeman R., H.Chen M., G.Gregori, S.Hatchett, D.Hey, N.Izumi, J.King, J.Kuba, P.Norreys, J.Mackinnon A., D.Murphy C., R.Snavely, B.Stephens R., C.Stoeckel, W.Theobald, B.Zhang and, B.Zhang. Temperature sensitivity of Cu Kα imaging efficiency using a spherical Bragg reflecting crystal. Phys. Plasmas, 14, 023102(2007).

    [30] R. K.Appartaim, K.Appartaim R., B. T.Maakuu. X-pinch x-ray sources driven by a 1 μs capacitor discharge. Phys. Plasmas, 15, 072703(2008).

    [31] L. E.Aranchuk, E.Aranchuk L., J.Larour. Absolute spectral radiation measurements from 200-ns 200-kA X-pinch in 10-eV–10-keV range with 1-ns resolution. IEEE Trans. Plasma Sci., 37, 575(2009).

    [32] R.Zhang, R.Zhang, H.Luo, X.Zou, H.Shi, X.Zhu, S.Zhao, X.Wang, S.Yap, C. and, H.Luo, R.Zhang, H.Luo, X.Zou, H.Shi, X.Zhu, S.Zhao, X.Wang, S.Yap, C. and, X.Zou, R.Zhang, H.Luo, X.Zou, H.Shi, X.Zhu, S.Zhao, X.Wang, S.Yap, C. and, H.Shi, R.Zhang, H.Luo, X.Zou, H.Shi, X.Zhu, S.Zhao, X.Wang, S.Yap, C. and, X.Zhu, R.Zhang, H.Luo, X.Zou, H.Shi, X.Zhu, S.Zhao, X.Wang, S.Yap, C. and, S.Zhao, R.Zhang, H.Luo, X.Zou, H.Shi, X.Zhu, S.Zhao, X.Wang, S.Yap, C. and, X.Wang, R.Zhang, H.Luo, X.Zou, H.Shi, X.Zhu, S.Zhao, X.Wang, S.Yap, C. and, S.Yap, R.Zhang, H.Luo, X.Zou, H.Shi, X.Zhu, S.Zhao, X.Wang, S.Yap, C. and, C. S.Wong. Energy spectrum measurement of X-ray radiation from a compact X-pinch device. IEEE Trans. Plasma Sci., 42, 3143(2014).

    [33] C.Pavez, C.Pavez, A.Sepulveda, N.Cabrini, A.Pedreros J., G.Avaria, I. P., L.Soto and, A.Sepulveda, C.Pavez, A.Sepulveda, N.Cabrini, A.Pedreros J., G.Avaria, I. P., L.Soto and, N.Cabrini, C.Pavez, A.Sepulveda, N.Cabrini, A.Pedreros J., G.Avaria, I. P., L.Soto and, J. A.Pedreros, C.Pavez, A.Sepulveda, N.Cabrini, A.Pedreros J., G.Avaria, I. P., L.Soto and, G.Avaria, C.Pavez, A.Sepulveda, N.Cabrini, A.Pedreros J., G.Avaria, I. P., L.Soto and, P. I. S.Martin, C.Pavez, A.Sepulveda, N.Cabrini, A.Pedreros J., G.Avaria, I. P., L.Soto and, L.Soto. Energetics X-ray burst observation in the collapse of an X-pinch conducted in a small capacitive generator of low impedance. IEEE Trans. Plasma Sci., 46, 3829(2018).

    [34] G. V.Ivanenkov, V.Ivanenkov G., W.Stepniewski, S. and, W.Stepniewski, V.Ivanenkov G., W.Stepniewski, S. and, S. Y.Gus’kov. MHD processes during the cascade development of the neck and hot spot in an X-pinch. Plasma Phys. Rep., 34, 619(2008).

    [35] S. A.Pikuz, A.Pikuz S., A.Shelkovenko T., D. and, T. A.Shelkovenko, A.Pikuz S., A.Shelkovenko T., D. and, D. A.Hammer. X-pinch. Part II. Plasma Phys. Rep., 41, 445(2015).

    [36] T. A.Shelkovenko, A.Shelkovenko T., A.Pikuz S., N.Tilikin I., N.Bland S., D.Lall, N.Chaturvedi, A.Georgakis and, S. A.Pikuz, A.Shelkovenko T., A.Pikuz S., N.Tilikin I., N.Bland S., D.Lall, N.Chaturvedi, A.Georgakis and, I. N.Tilikin, A.Shelkovenko T., A.Pikuz S., N.Tilikin I., N.Bland S., D.Lall, N.Chaturvedi, A.Georgakis and, S. N.Bland, A.Shelkovenko T., A.Pikuz S., N.Tilikin I., N.Bland S., D.Lall, N.Chaturvedi, A.Georgakis and, D.Lall, A.Shelkovenko T., A.Pikuz S., N.Tilikin I., N.Bland S., D.Lall, N.Chaturvedi, A.Georgakis and, N.Chaturvedi, A.Shelkovenko T., A.Pikuz S., N.Tilikin I., N.Bland S., D.Lall, N.Chaturvedi, A.Georgakis and, A.Georgakis. X-pinch X-ray emission on a portable low-current, fast rise-time generator. J. Appl. Phys., 124, 083303(2018).

    [37] C.Christou, C.Christou, E.Dangor A., D. and, A. E.Dangor, C.Christou, E.Dangor A., D. and, D. A.Hammer. Characterization of wire x pinches driven by a microsecond-long capacitive discharge. J. Appl. Phys., 87, 8295(2000).

    Seunggi Ham, Jonghyeon Ryu, Hakmin Lee, Sungbin Park, Y.-C. Ghim, Y. S. Hwang, Kyoung-Jae Chung. Estimation of plasma parameters of X-pinch with time-resolved x-ray spectroscopy[J]. Matter and Radiation at Extremes, 2023, 8(3): 036901
    Download Citation