
Minjun Yang, Wei Zhan, Wuzhou Song. Photothermal Effect Based Single Fiber Trapping Method and Simulation Analysis[J]. Chinese Journal of Lasers, 2019, 46(8): 0806006
- Chinese Journal of Lasers
- Vol. 46, Issue 8, 0806006 (2019)
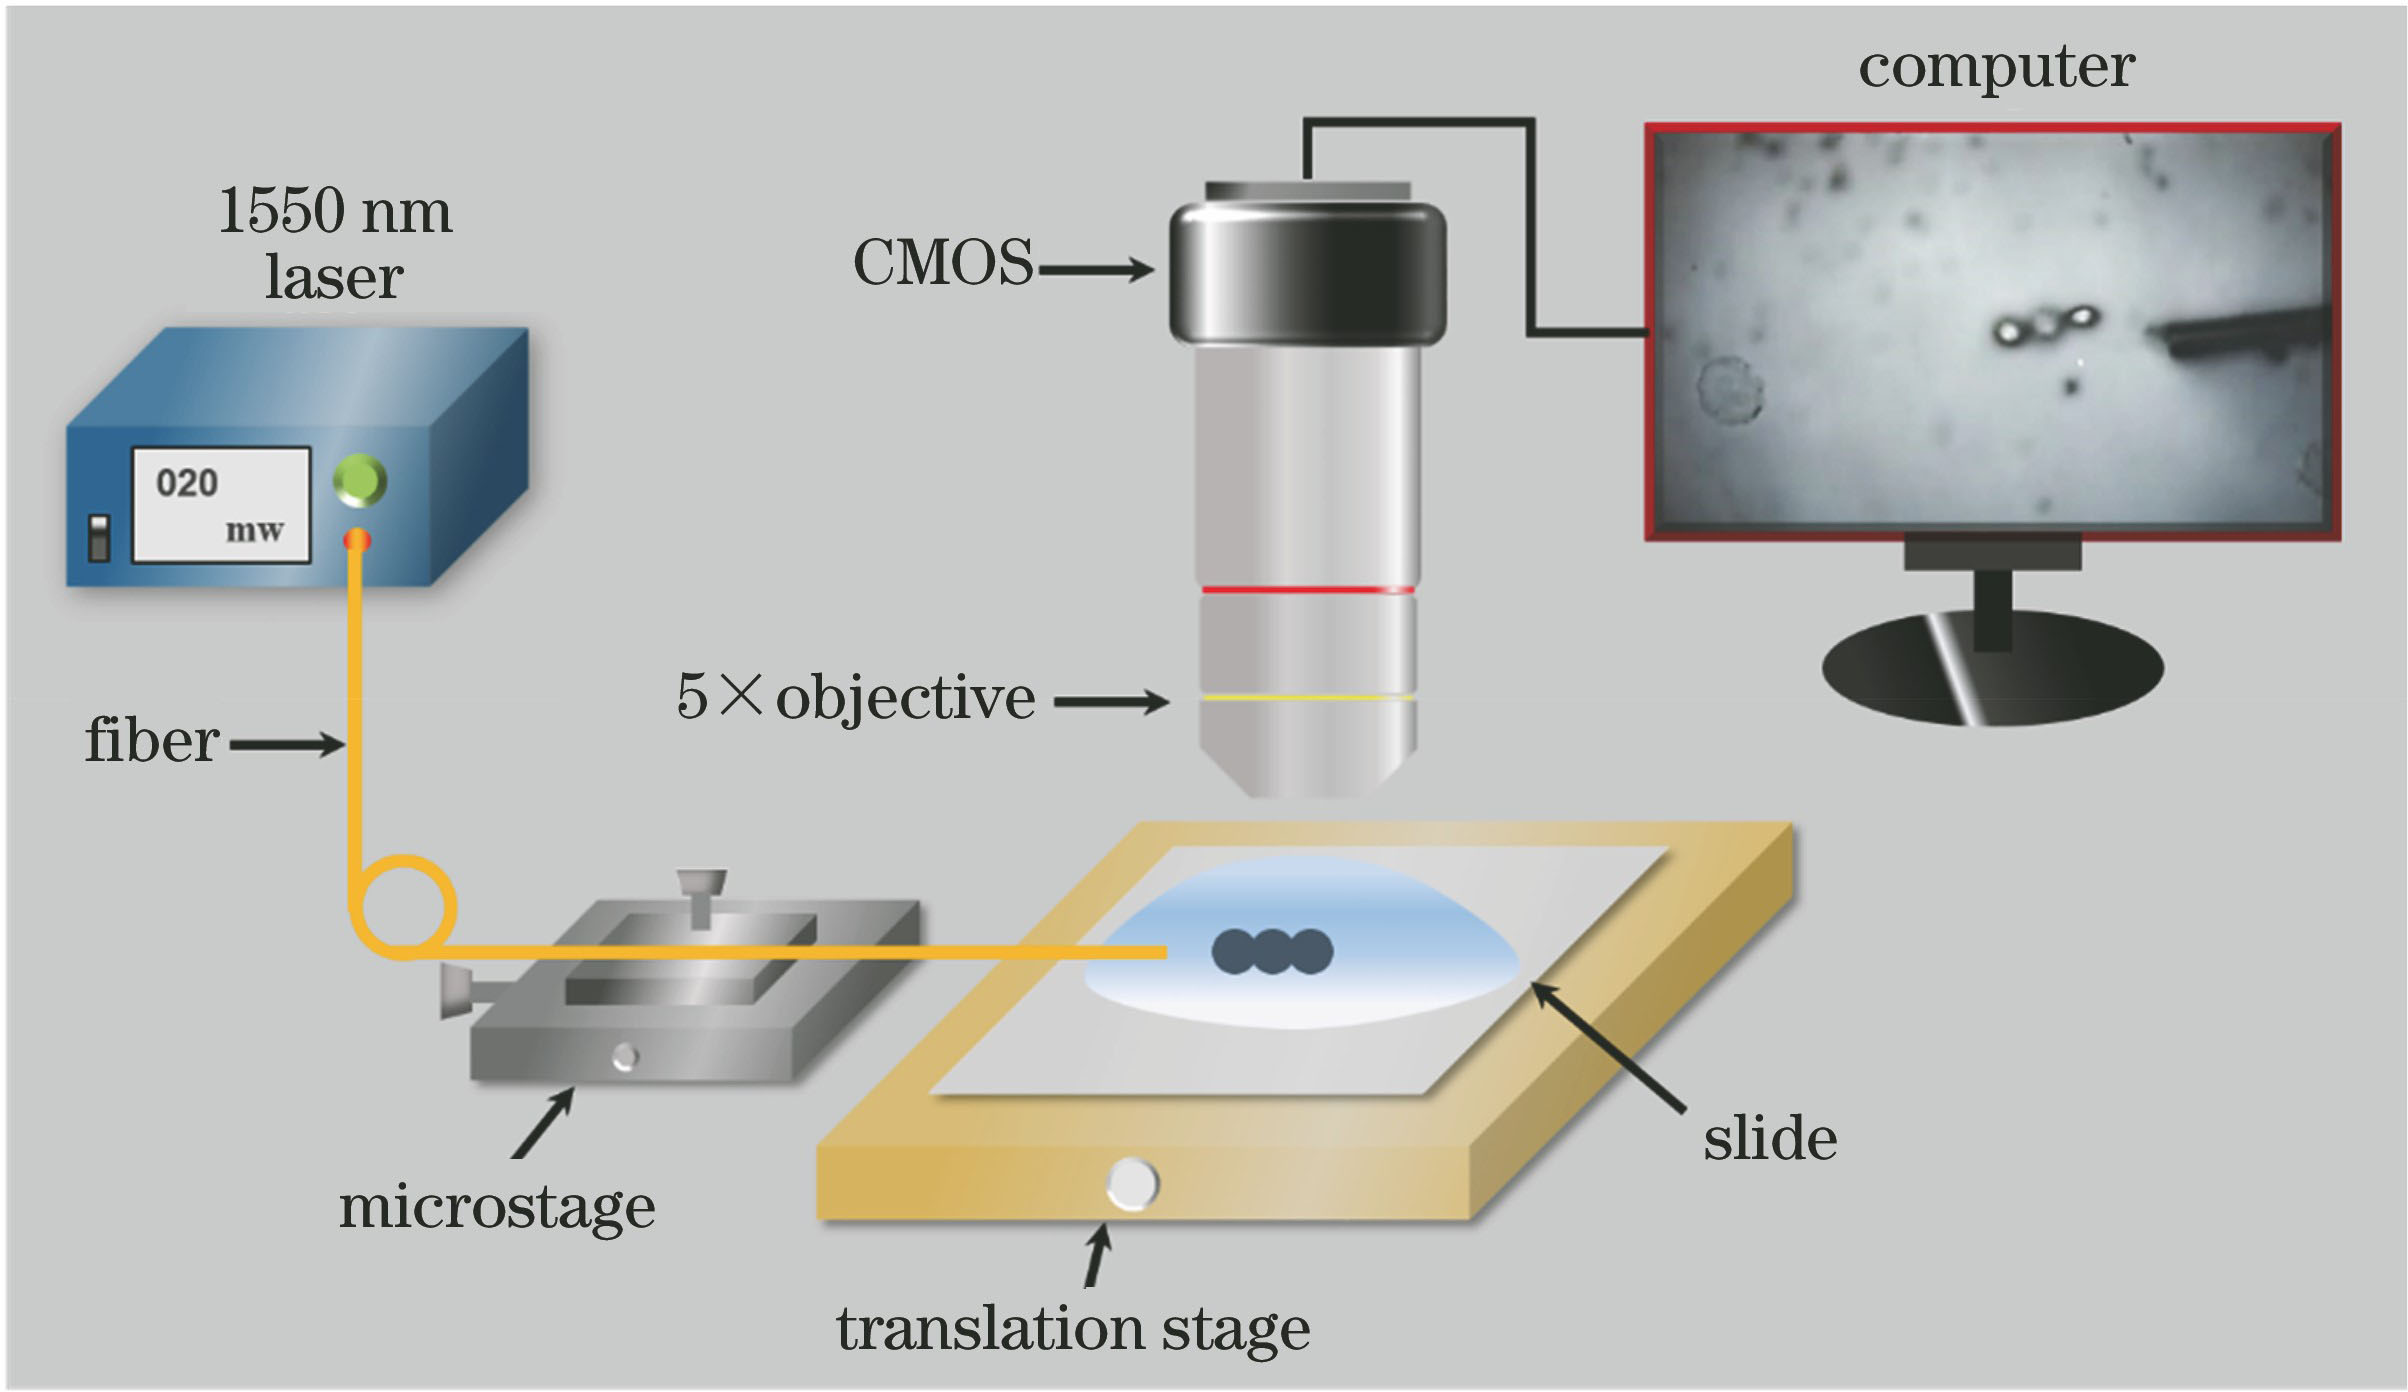
Fig. 1. Experimental setup for particle capture based on photothermal effect
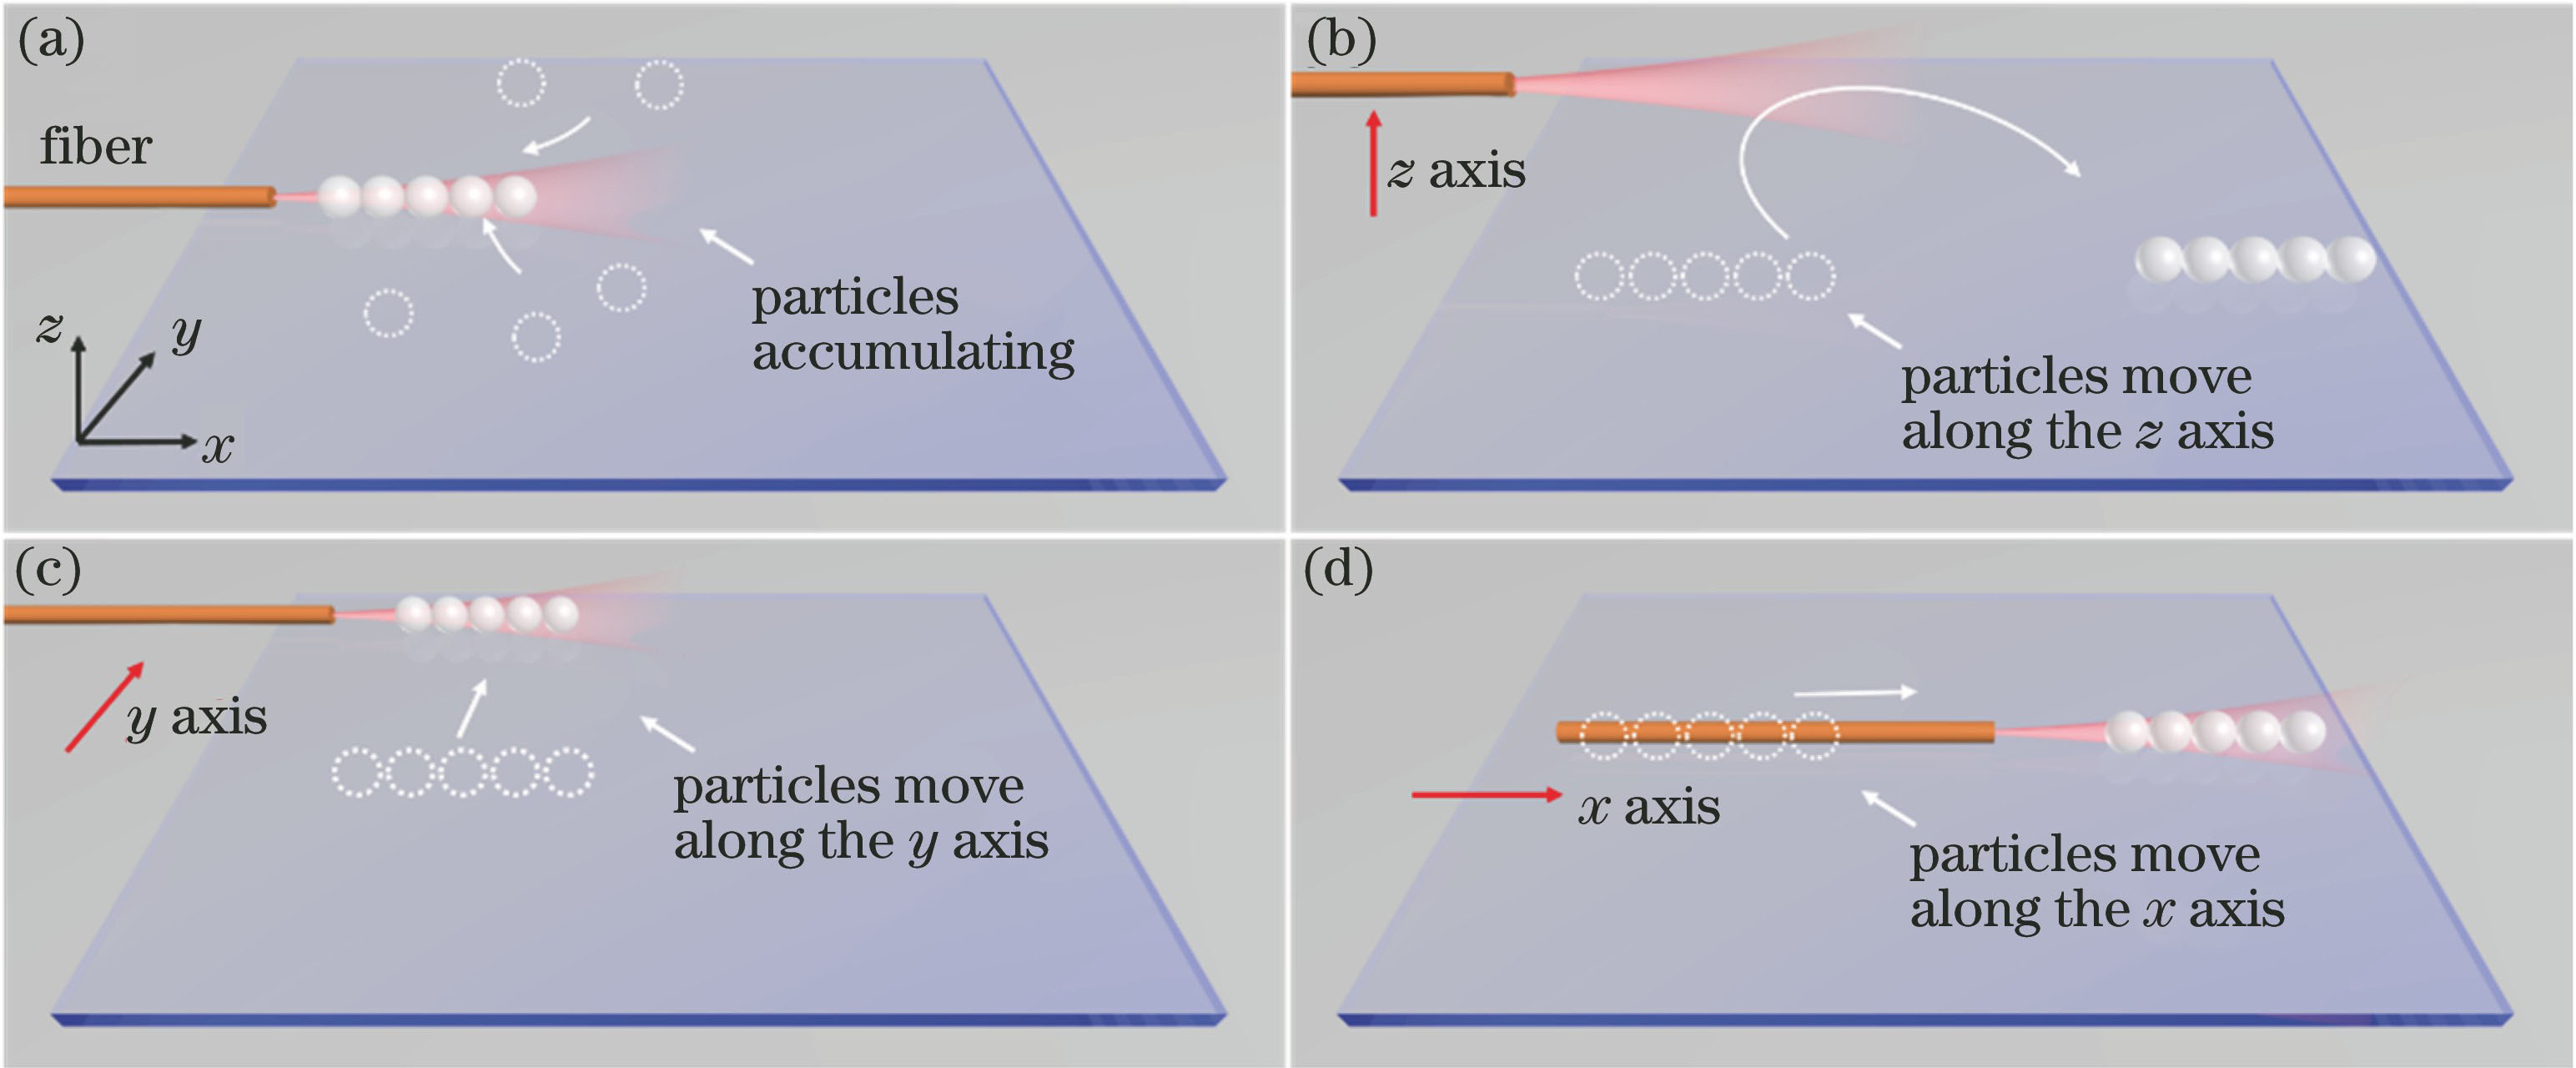
Fig. 2. Diagrams of optical manipulation for SiO2 sphere based on thermal convection effect. (a) Fiber being stationary; (b) fiber moving along z axis; (c) fiber moving along y axis; (d) fiber moving along x axis
Fig. 3. Optical microscope images of lateral movement of SiO2 sphere by vertical movement of fiber (top view). (a) t=0 s, fiber is located at z=500 μm; (b) t=3.2 s, fiber is located at z=300 μm; (c) t=5.8 s, fiber is located at z=150 μm; (d) t=6.1 s, fiber is located at z=80 μm; (e) t=9.6 s, fiber is located at z=350 μm; (f) t=11.3 s, fiber is located at z=550 μm
Fig. 4. Simulation results of heat transfer field (HT) and convective velocity field (FM) at different heights of fiber. (a) Temperature field distribution of fiber at z=50 μm; (b) temperature field distribution of fiber at z=550 μm; (c) convective velocity field distribution of fiber at z=50 μm; (d) convective velocity field distribution of fiber at z=550 μm
Fig. 5. Trajectories of silica sphere at z=50 μm at different times. (a) t=1.2 s; (b) t=4.3 s; (c) t=8.2 s; (d) t=12.7 s
Fig. 6. Trajectories of silica sphere at z=550 μm at different time. (a) t=1.2 s; (b) t=8.1 s; (c) t=16.5 s; (d) t=23.3 s
Fig. 7. Electromagnetic field (EM) distributions of fiber and optical trapping force distributions of SiO2 sphere. (a) EM distribution of optical fiber in suspension; (b) EM distribution of SiO2 sphere with chain structure; (c) axial optical force distribution of SiO2 sphere; (d) transverse optical force distribution of SiO2 sphere

Set citation alerts for the article
Please enter your email address
© Copyright 2018-2021 | Chinese Laser Press. All Rights Reserved 沪ICP备15018463号-20