• Photonics Research
  • Vol. 6, Issue 5, 346 (2018)
Steven H. Huang1, Xuefeng Jiang1, Bo Peng1, Corey Janisch2, Alexander Cocking2, Şahin Kaya Özdemir1, Zhiwen Liu2, and Lan Yang1、*
Author Affiliations
  • 1Department of Electrical and Systems Engineering, Washington University in St. Louis, St. Louis, Missouri 63130, USA
  • 2Department of Electrical Engineering, Pennsylvania State University, University Park, Pennsylvania 16802, USA
  • show less
    DOI: 10.1364/PRJ.6.000346 Cite this Article Set citation alerts
    Steven H. Huang, Xuefeng Jiang, Bo Peng, Corey Janisch, Alexander Cocking, Şahin Kaya Özdemir, Zhiwen Liu, Lan Yang. Surface-enhanced Raman scattering on dielectric microspheres with whispering gallery mode resonance[J]. Photonics Research, 2018, 6(5): 346 Copy Citation Text show less
    Schematic of the experimental setup. Inset: top view (left) and side view (right) of a typical on-chip microsphere used in the experiment.
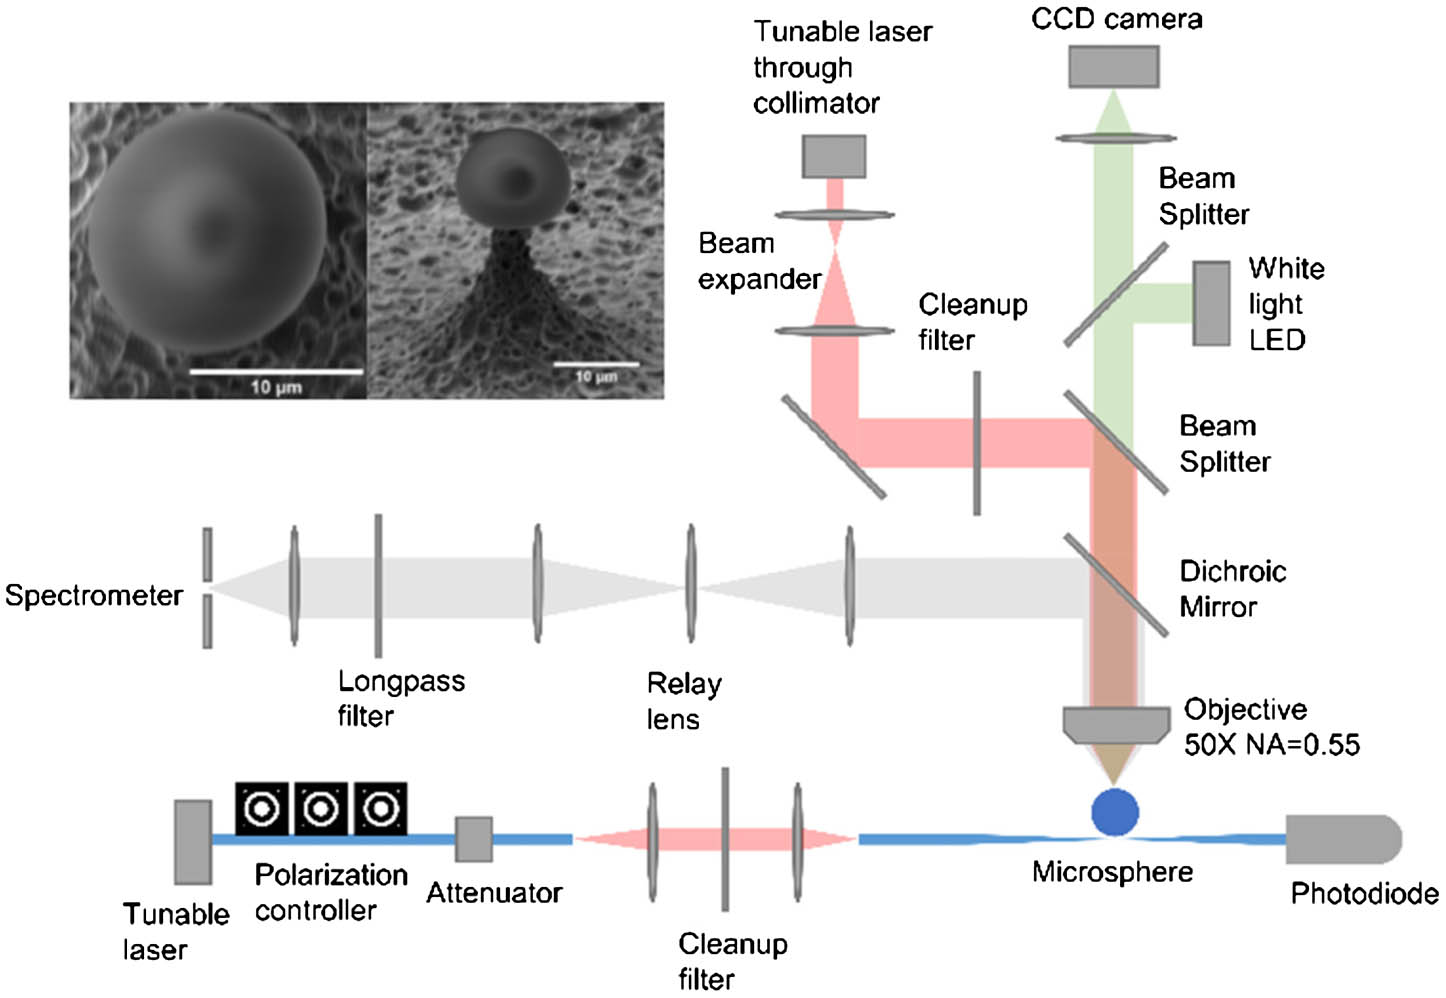
    Fig. 1. Schematic of the experimental setup. Inset: top view (left) and side view (right) of a typical on-chip microsphere used in the experiment.
    Raman lasing and thermal effects in silica microspheres. (a) Raman intensity dependence on pump power for a bare silica microsphere. Inset shows the linear dependence of Raman intensity on pump power in the spontaneous Raman emission regime. (b) Measured transmission spectrum through the fiber taper coupler around a typical WGM resonance. Inset shows the transmission spectrum (blue curve) of the same modes at a higher power typically used for Raman pumping, with significant thermal broadening. The red triangular waveform corresponds to the scanning of the pump laser wavelength; the left half corresponds to a decreasing pump wavelength, while the right half corresponds to an increasing pump wavelength. The oscillation seen in the thermally broadened WGM is due to interference effect from reflection at fiber ends, which is unrelated to the WGM resonance.
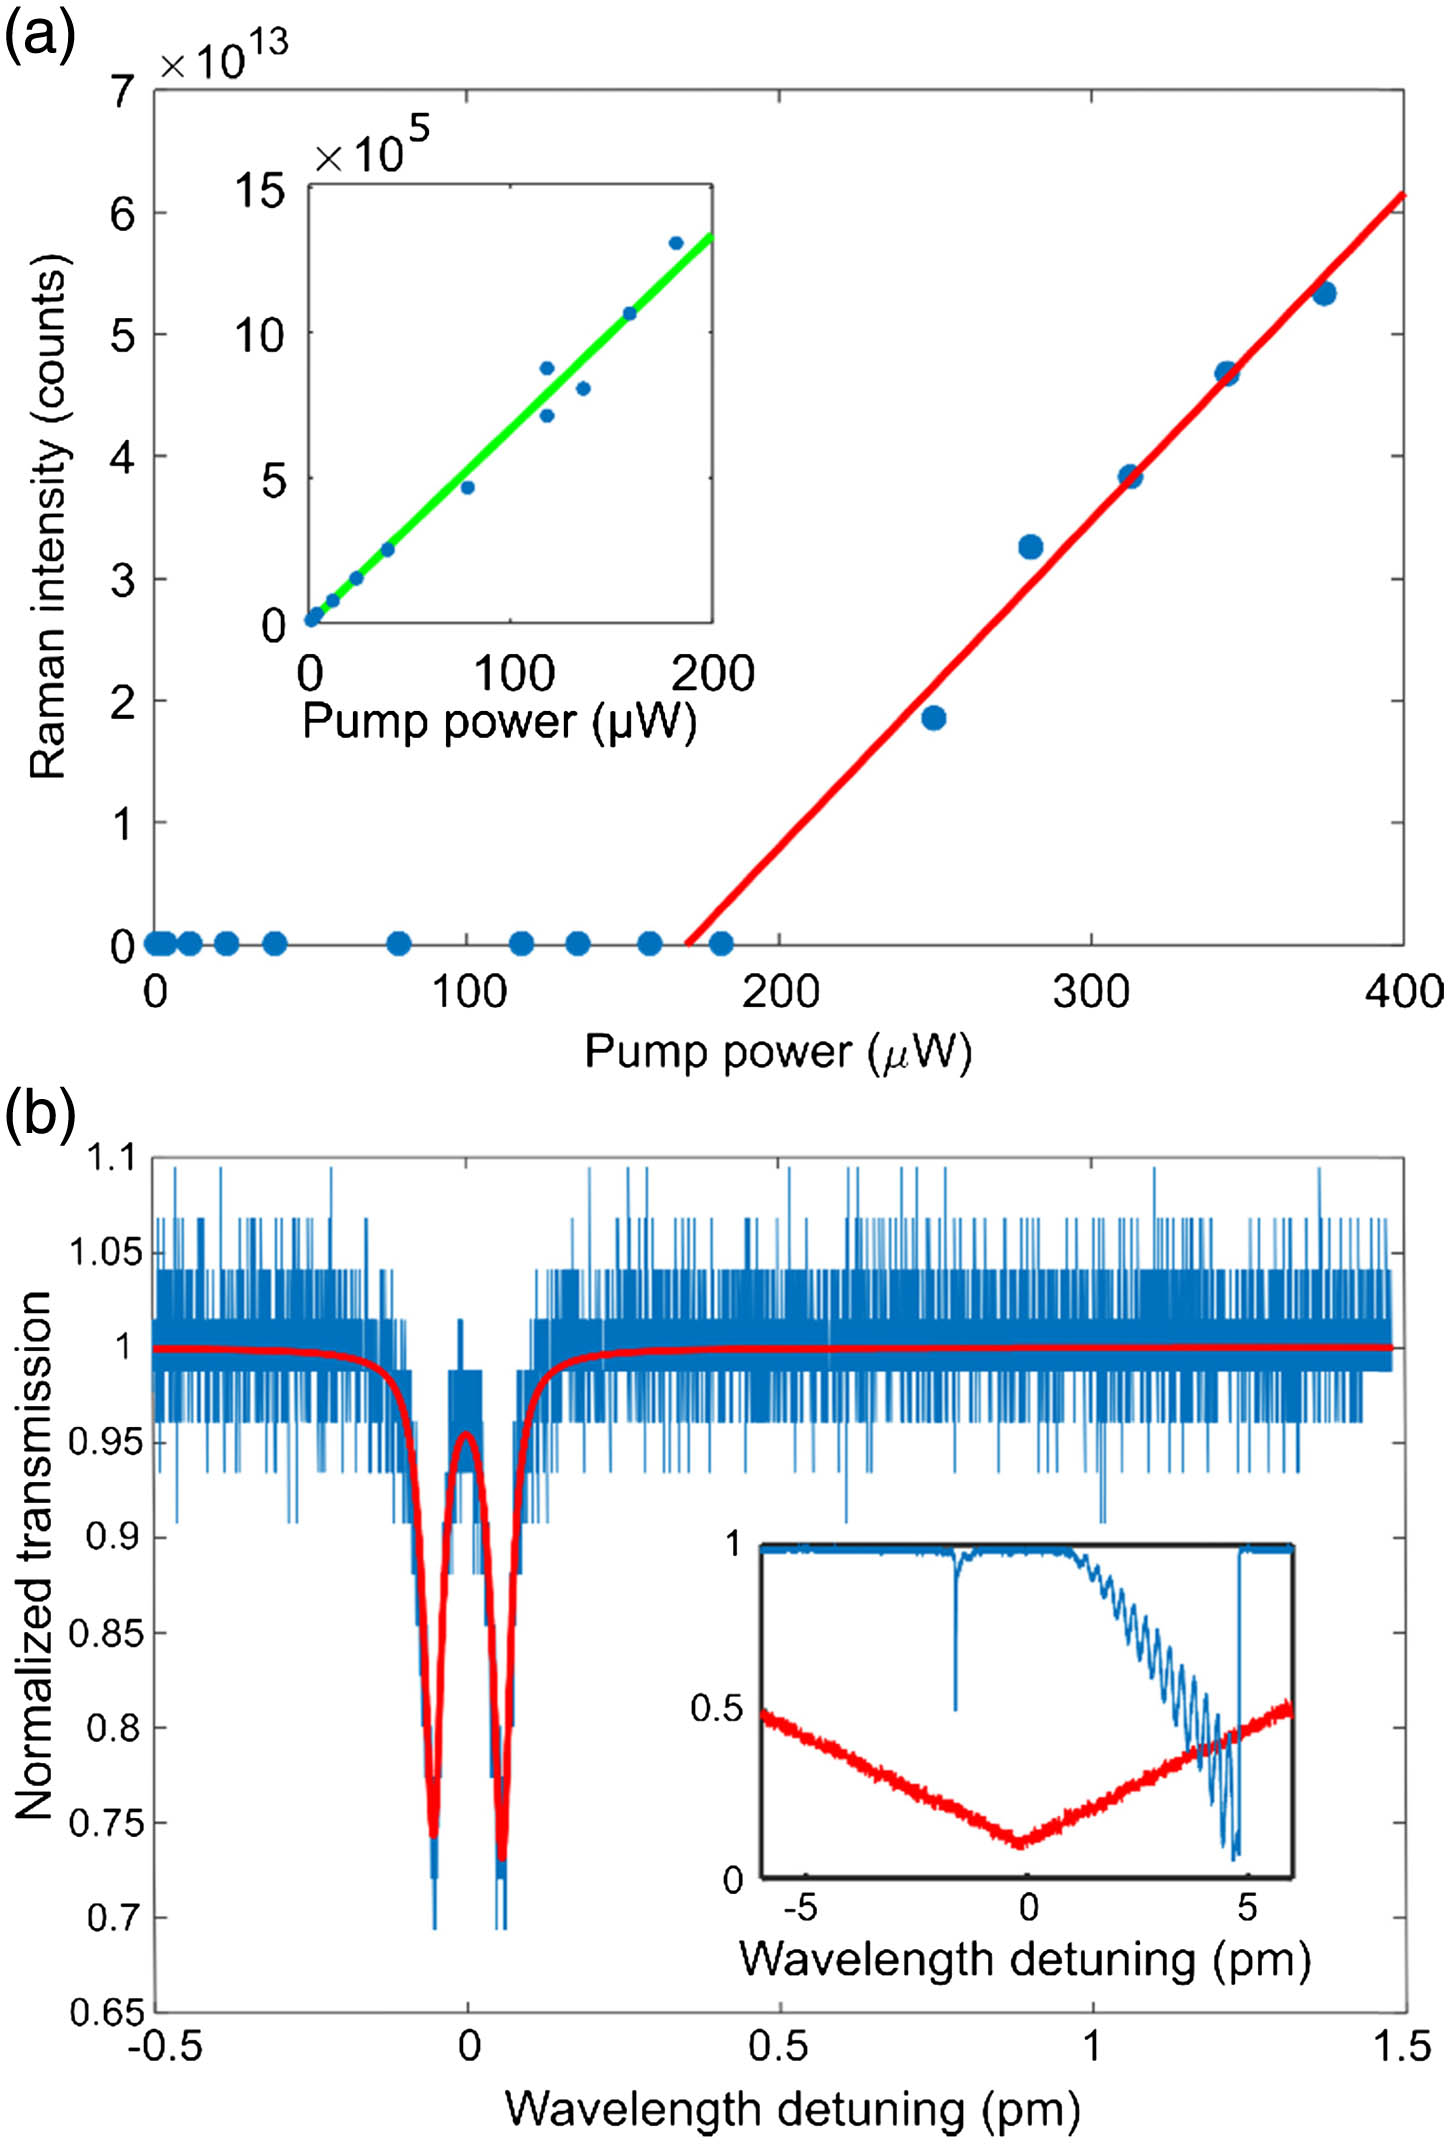
    Fig. 2. Raman lasing and thermal effects in silica microspheres. (a) Raman intensity dependence on pump power for a bare silica microsphere. Inset shows the linear dependence of Raman intensity on pump power in the spontaneous Raman emission regime. (b) Measured transmission spectrum through the fiber taper coupler around a typical WGM resonance. Inset shows the transmission spectrum (blue curve) of the same modes at a higher power typically used for Raman pumping, with significant thermal broadening. The red triangular waveform corresponds to the scanning of the pump laser wavelength; the left half corresponds to a decreasing pump wavelength, while the right half corresponds to an increasing pump wavelength. The oscillation seen in the thermally broadened WGM is due to interference effect from reflection at fiber ends, which is unrelated to the WGM resonance.
    Raman emission from a bare silica microsphere. (a) Integrated Raman spectrum from a 13.8 μm silica microsphere. (b) Raman spectra from different positions in the microsphere. Red dotted circles in the inset indicate the positions from which the spectra were collected. (c) Measured Raman intensity dependence on pump detuning. Red curve shows a Lorentzian fit to the experimental data.
    Fig. 3. Raman emission from a bare silica microsphere. (a) Integrated Raman spectrum from a 13.8 μm silica microsphere. (b) Raman spectra from different positions in the microsphere. Red dotted circles in the inset indicate the positions from which the spectra were collected. (c) Measured Raman intensity dependence on pump detuning. Red curve shows a Lorentzian fit to the experimental data.
    Raman enhancement of rhodamine 6G through the silica microsphere. (a) Background subtracted Raman spectra of rhodamine 6G for tapered fiber coupler excitation (blue), free-space excitation on a microsphere (red), and free-space excitation on the substrate (green). The spectra for free-space excitation on the microsphere and substrate are scaled by 100 times for visibility. (b) Raman spectrum of rhodamine 6G around the 1510 cm−1 peak, obtained from subtracting the spectrum after photobleaching from the spectrum before photobleaching. The solid green curve is a fit to the data points. The spectrum is fitted as sum of a Lorentzian Raman peak (purple dotted curve) and two Gaussian WGM peaks (red dotted curve).
    Fig. 4. Raman enhancement of rhodamine 6G through the silica microsphere. (a) Background subtracted Raman spectra of rhodamine 6G for tapered fiber coupler excitation (blue), free-space excitation on a microsphere (red), and free-space excitation on the substrate (green). The spectra for free-space excitation on the microsphere and substrate are scaled by 100 times for visibility. (b) Raman spectrum of rhodamine 6G around the 1510  cm1 peak, obtained from subtracting the spectrum after photobleaching from the spectrum before photobleaching. The solid green curve is a fit to the data points. The spectrum is fitted as sum of a Lorentzian Raman peak (purple dotted curve) and two Gaussian WGM peaks (red dotted curve).
    Dependence of Raman intensity on ηpump. The wavelength scanning range of the pump laser was changed to obtain different ηpump.
    Fig. 5. Dependence of Raman intensity on ηpump. The wavelength scanning range of the pump laser was changed to obtain different ηpump.
    Change in Raman intensity as rhodamine 6G photobleaches. The pump power was 37 μW, coupled to the microsphere WGM through a tapered fiber.
    Fig. 6. Change in Raman intensity as rhodamine 6G photobleaches. The pump power was 37 μW, coupled to the microsphere WGM through a tapered fiber.
    Steven H. Huang, Xuefeng Jiang, Bo Peng, Corey Janisch, Alexander Cocking, Şahin Kaya Özdemir, Zhiwen Liu, Lan Yang. Surface-enhanced Raman scattering on dielectric microspheres with whispering gallery mode resonance[J]. Photonics Research, 2018, 6(5): 346
    Download Citation