• Journal of Natural Resources
  • Vol. 35, Issue 8, 1881 (2020)
Jia-ning ZHOU, Xue-hao BI, and Wei ZOU*
Author Affiliations
  • College of Public Administration, Nanjing Agricultural University, Nanjing 210095, China
  • show less
    DOI: 10.31497/zrzyxb.20200810 Cite this Article
    Jia-ning ZHOU, Xue-hao BI, Wei ZOU. Driving mechanism of urban-rural integration in Huaihai Economic Zone: Based on the space of flow[J]. Journal of Natural Resources, 2020, 35(8): 1881 Copy Citation Text show less
    LISA of urban-rural integration level in 2017
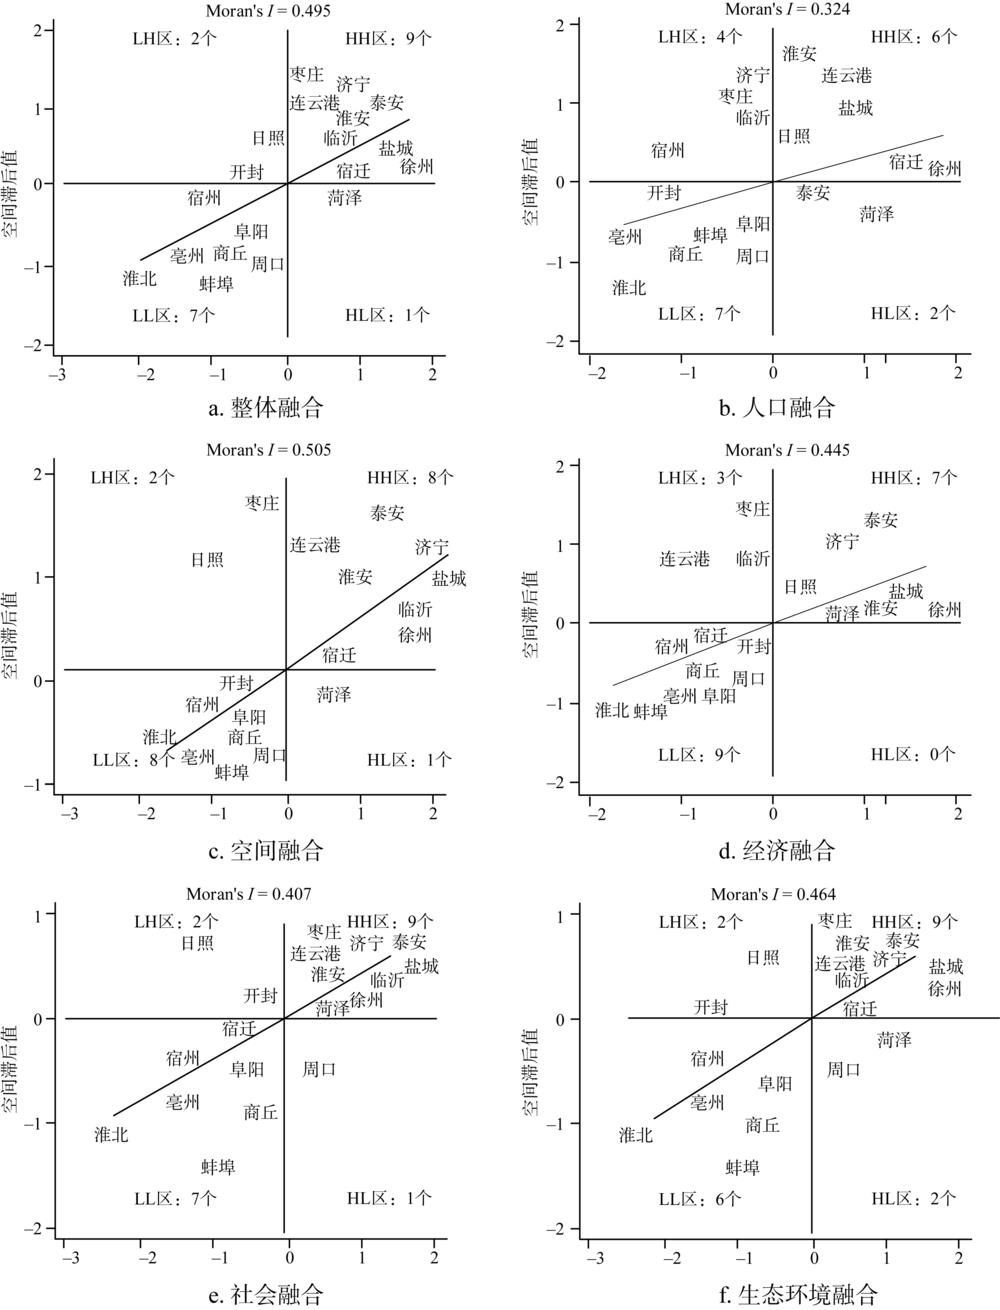
    Fig. 1. LISA of urban-rural integration level in 2017
    Network connection of factors flow in Huaihai Economic Zone, 2017
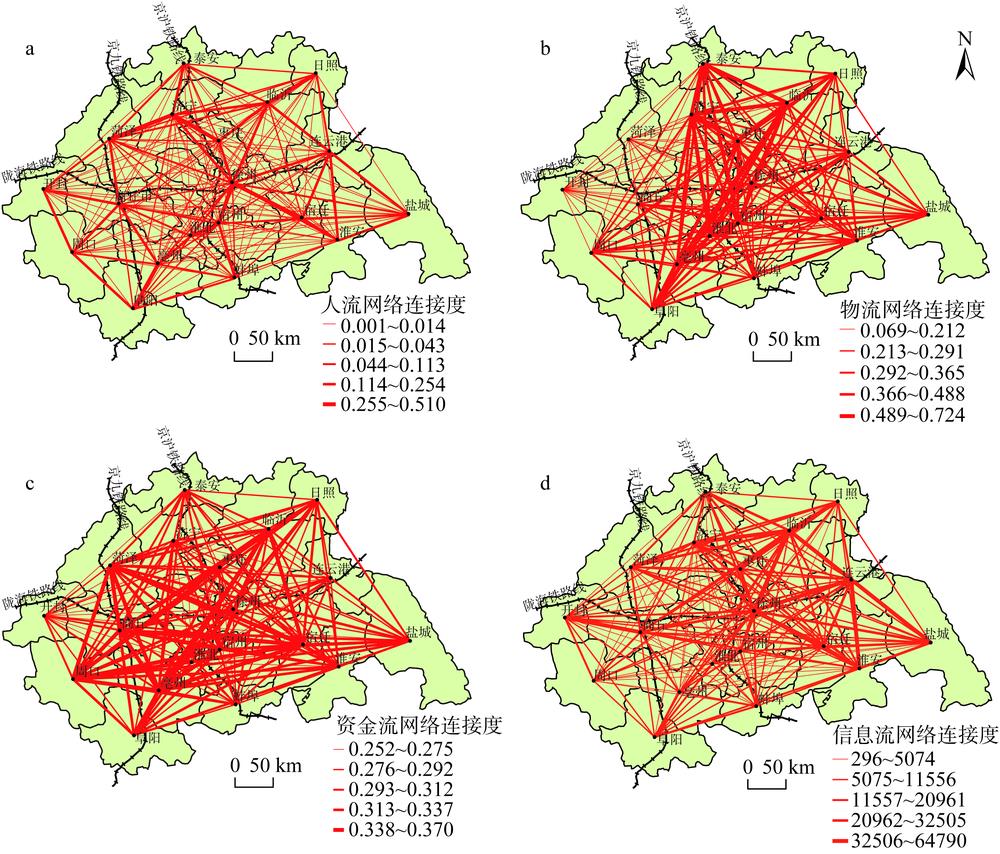
    Fig. 2. Network connection of factors flow in Huaihai Economic Zone, 2017
    维度序参量指标属性原上限值原下限值新上限值新下限值离差系数调节系数
    人口融合(R1x159.1827.7183.2419.701.710.20
    x219.879.9427.407.211.610.20
    x318.6912.8629.718.092.320.20
    x43.731.935.761.251.450.30
    空间融合(R2x52.171.102.580.920.690.25
    x667.6934.3297.7323.771.470.25
    x779.5640.31156.9620.431.360.50
    x888.4344.55135.4429.091.420.30
    x991.2157.15118.7543.901.760.15
    经济融合(R3x1054.2037.6068.7029.661.190.20
    x115.773.607.872.641.240.25
    x121.350.992.120.631.130.40
    x1346.2623.8886.0112.841.770.35
    社会融合(R4x145.230.045.260.040.470.01
    x1536.962.9437.152.930.510.01
    x1681.100.5481.290.540.230.01
    x1751.311.3151.681.300.360.02
    生态环境融合(R5x1815.757.8838.353.241.780.50
    x1977.8111.6577.8711.640.080.01
    x205.130.275.150.270.120.03
    x2198.3421.1399.4220.900.270.04
    x2295.3135.3195.5635.220.130.02
    x2396.5337.3597.2037.090.140.05
    x2496.7933.3196.9033.270.110.01
    Table 1. Descriptive statistics of indicators
    年份200320042005200620072008200920102011201220132014201520162017
    R¯(×10-1)0.1620.1680.1830.1910.1980.1990.2020.2170.2160.2390.2610.2670.2720.2750.279
    Moran's I0.4360.3510.2830.3880.3910.4550.3800.4490.4750.5220.5480.4750.3800.4620.501
    P0.0000.0020.0080.0010.0010.0000.0010.0000.0000.0000.0000.0000.0010.0000.000
    Table 2. Moran's I index and average value of R in Huaihai Economic Zone from 2003 to 2017
    排序城市节点FiFr排序城市节点FiFr
    1临沂市1.2511.00012淮安市0.6280.083
    2徐州市1.1540.50013菏泽市0.5520.077
    3宿州市0.9670.33314盐城市0.5520.071
    4济宁市0.9410.25015日照市0.5440.067
    5宿迁市0.8780.20016泰安市0.5030.063
    6毫州市0.8720.16717淮北市0.4880.059
    7商丘市0.7890.14318蚌埠市0.3720.056
    8连云港市0.7240.12519开封市0.1760.053
    9阜阳市0.7100.111标准差(Sd0.2630.227
    10枣庄市0.6850.100SSI0.432
    11周口市0.6730.091
    Table 3. Spatial structure index (SSI) in Huaihai Economic Zone, 2017
    空间效应
    LM检验
    综合融合人口融合空间融合经济融合社会融合生态环境融合
    统计量P统计量P统计量P统计量P统计量P统计量P
    LM-Err检验66.5940.00016.2240.00075.7430.00071.6050.00053.6660.00052.6390.000
    稳健LM-Err检验70.0610.00014.2690.00079.7940.00083.4780.00052.5080.00052.6850.000
    LM-Lag检验1.1930.2752.3440.1260.9940.3191.2790.2582.2570.1331.6580.198
    稳健LM-Lag检验4.6600.0310.3900.5335.0450.02513.1520.0001.0990.2941.7030.192
    Table 4. LM test for spatial econometric model selection
    变量整体融合人口融合空间融合经济融合社会融合生态环境融合
    (1)(2)(3)(4)(5)(6)
    人口流动0.007***0.011***0.003***0.020***0.003***0.005***
    物质流动0.002***0.0030.001**0.010***0.0010.002**
    资金流动0.003***0.004*0.001**-0.007*0.003***0.004***
    信息流动0.006**0.0040.004***0.0060.006***0.007***
    人均GDP0.009***0.014***0.003***0.028***0.004***0.007***
    人均GDP二次项-0.041***-0.043*-0.023***-0.021-0.037***-0.047***
    产业结构升级0.012**0.0130.006**-0.0020.011***0.015***
    地方发展政策0.001*0.0010.001***0.004*0.0000.000
    国家发展政策0.001***0.0020.001***0.005***0.001**0.001***
    lambda0.042**0.045**0.068***0.047**0.048**0.027
    Obs285285285285285285
    R20.3410.3500.3190.3010.2670.320
    模型选择SEM-FE
    Table 5. Estimation results based on SEM
    Jia-ning ZHOU, Xue-hao BI, Wei ZOU. Driving mechanism of urban-rural integration in Huaihai Economic Zone: Based on the space of flow[J]. Journal of Natural Resources, 2020, 35(8): 1881
    Download Citation