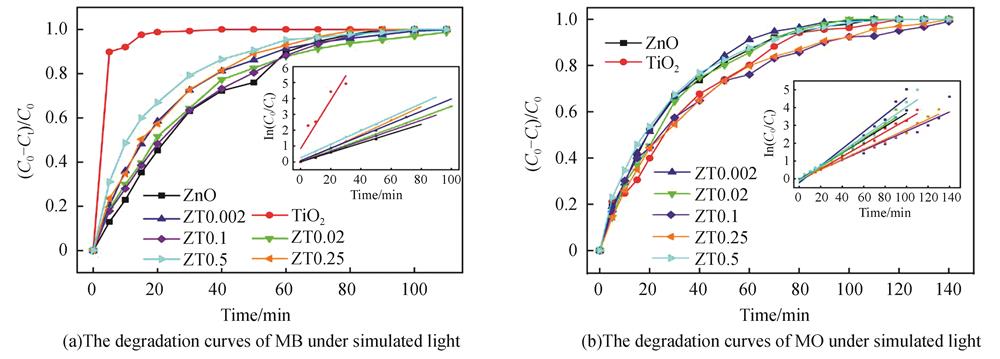
Fig. 1. Photodegradation curves of MB and MO of pure ZnO,commercial TiO2 and ZnO/TiO2 nanocomposites under simulated light(The inset is the fitting of the pseudo-first-order kinetic function)
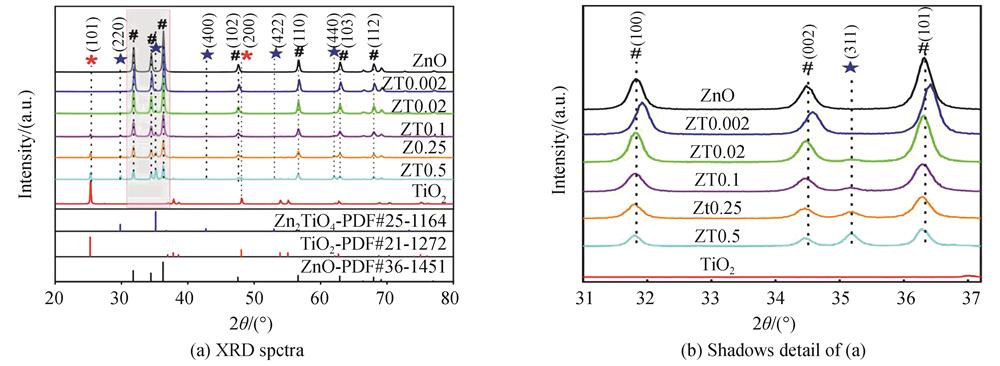
Fig. 2. XRD spectra of pure ZnO,commercial TiO2 and ZnO/TiO2 nanocomposites samples
Fig. 3. High-resolution TEM images and SAED images of sample ZT0.002 and ZT0.5
Fig. 4. SEM images of samples
Fig. 5. The particle size distribution
Fig. 6. XPS spectra of samples
Fig. 7. The oxygen content ratio diagram of samples
Fig. 8. Energy paramagnetic resonance spectra of the samples at room temperature
Fig. 9. UV-vis absorption spectra of samples
Fig. 10. The surface photovoltage spectra of samples
Fig. 11. Effect of different scavengers on the photocatalytic degradation of MB and MO over ZT0.002
Fig. 12. Photocatalytic schematic
Fig. 13. The efficiency curves of MB,MO degradation of ZT0.002 sample under simulated sunlight in different
Samples | Ti | Zn | Ti/(Ti+Zn) |
---|
Weight percentage/wt% | Weight percentage/wt% | Mole percentage/(mol·mol-1) |
---|
ZT0.002 | 0.13 | 66.92 | 0.26 | ZT0.02 | 1.04 | 65.45 | 2.11 | ZT0.1 | 5.20 | 59.23 | 10.63 | ZT0.25 | 11.56 | 56.11 | 21.81 | ZT0.5 | 11.84 | 31.21 | 33.94 |
|
Table 1. The weight percentages of elements Ti and Zn and mole percentages of Ti/(Ti+Zn)in the samples ZT0.002,ZT0.02,ZT0.1,ZT0.25,ZT0.5
Sample | Organic pollutant | Linear fitting equation | Apparent chemical reaction rate constant | Linearly dependent coefficient R |
---|
ZnO | MB | y=0.029 47x+0.009 1 | 0.029 47 | 0.993 97 | MO | y=0.037 38x-0.050 44 | 0.037 38 | 0.996 96 | TiO2 | MB | y=0.153 02x+0.841 02 | 0.153 02 | 0.942 33 | MO | y=0.034 54x-0.139 14 | 0.034 54 | 0.991 49 | ZT0.002 | MB | y=0.388 3x+0.085 03 | 0.038 83 | 0.999 21 | MO | y=0.047 73x-0.228 42 | 0.047 73 | 0.988 52 | ZT0.02 | MB | y=0.034 93x+0.004 14 | 0.034 93 | 0.999 91 | MO | y=0.039 95x-0.146 5 | 0.039 95 | 0.987 56 | ZT0.1 | MB | y=0.032 67x+0.008 91 | 0.032 67 | 0.999 71 | MO | y=0.026 98x-0.020 11 | 0.026 98 | 0.980 09 | ZT0.25 | MB | y=0.043 78x-0.024 02 | 0.043 78 | 0.999 44 | MO | y=0.028 29x-0.048 49 | 0.028 29 | 0.994 72 | ZT0.5 | MB | y=0.042 64x+0.259 68 | 0.042 64 | 0.998 96 | MO | y=0.041 41x-0.112 19 | 0.041 41 | 0.986 94 |
|
Table 2. The performance parameters of pure ZnO,commercial TiO2 and ZnO/TiO2 nanocomposites degradation of MB and MO under simulated light
Type of catalysts | Organic pollutant | Initial concentration | Catalyst dose | Light irradiated | Irradiation time | Removal efficiency | References |
---|
ZnO/TiO2 | MB | 4 mg/L | 0.5 g/L | Simulated sunlight | 80 min | 93% | This work | MO | 90 min | 90% | ZnO/TiO2 | MB | 5 mg/L | 1.5 g/L | UV,λmax=365 nm | 60 min | 100% | [3] | MO | 20 mg/L | 50 g/L | 90 min | 99% | Cu2O/ZnO | MO | 10 mmol/L | -- | Visible light | 5 h | 90% | [7] | ZnO/TiO2 | MB | 0.01 mmol/L | -- | Simulated sunlight | 180 min | 100% | [16] | CuO/TiO2 | MB | 5 mg/L | -- | Simulated sunlight | 60 min | 40% | [17] | NiO/TiO2 | MO | 10 mg/L | 1.43 g/L | UV,λmax=253.7 nm | 1 h | 87.3% | [18] | Visible light | 95.6% | TiO2/Fe2O3 | MB | 0.01 mmol/L | 1 g/L | UV | 5 h | 95.2% | [26] | Visible light | 2 h | 96% | CdS/TiO2 | MO | 5 mg/L | 2 g/L | Simulated sunlight | 120 min | 95.3% | [27] | ZnO/CdS | MB | 0.01 mmol/L | 0.25 g/L | Sunlight | 120 min | 100% | [28] |
|
Table 3. Photodegradation of different semiconductor composite photocatalysts on organic pollutants
Samples | Average grain size/nm | Average particle size/nm | Specific surface area/(m2·g-1) |
---|
ZnO | 25 | 63.84 | 9.133 2 | TiO2 | 37 | 116.78 | 9.767 2 | ZT0.002 | 24 | 79.41 | 7.276 2 | ZT0.02 | 25 | 60.39 | -- | ZT0.1 | 24 | 46.53 | -- | ZT0.25 | 26 | 36.36 | 9.470 2 | ZT0.5 | 28 | 69.25 | 6.742 5 |
|
Table 4. The parameters of pure ZnO,commercial TiO2 and ZnO/TiO2 nanocomposites