
Shengheng Zheng, Yuanhong Yang. High Precision and Accuracy Wavelength Tuning Characteristics of Modulated Grating Y-Branch Tunable Lasers[J]. Chinese Journal of Lasers, 2019, 46(2): 0201001
- Chinese Journal of Lasers
- Vol. 46, Issue 2, 0201001 (2019)
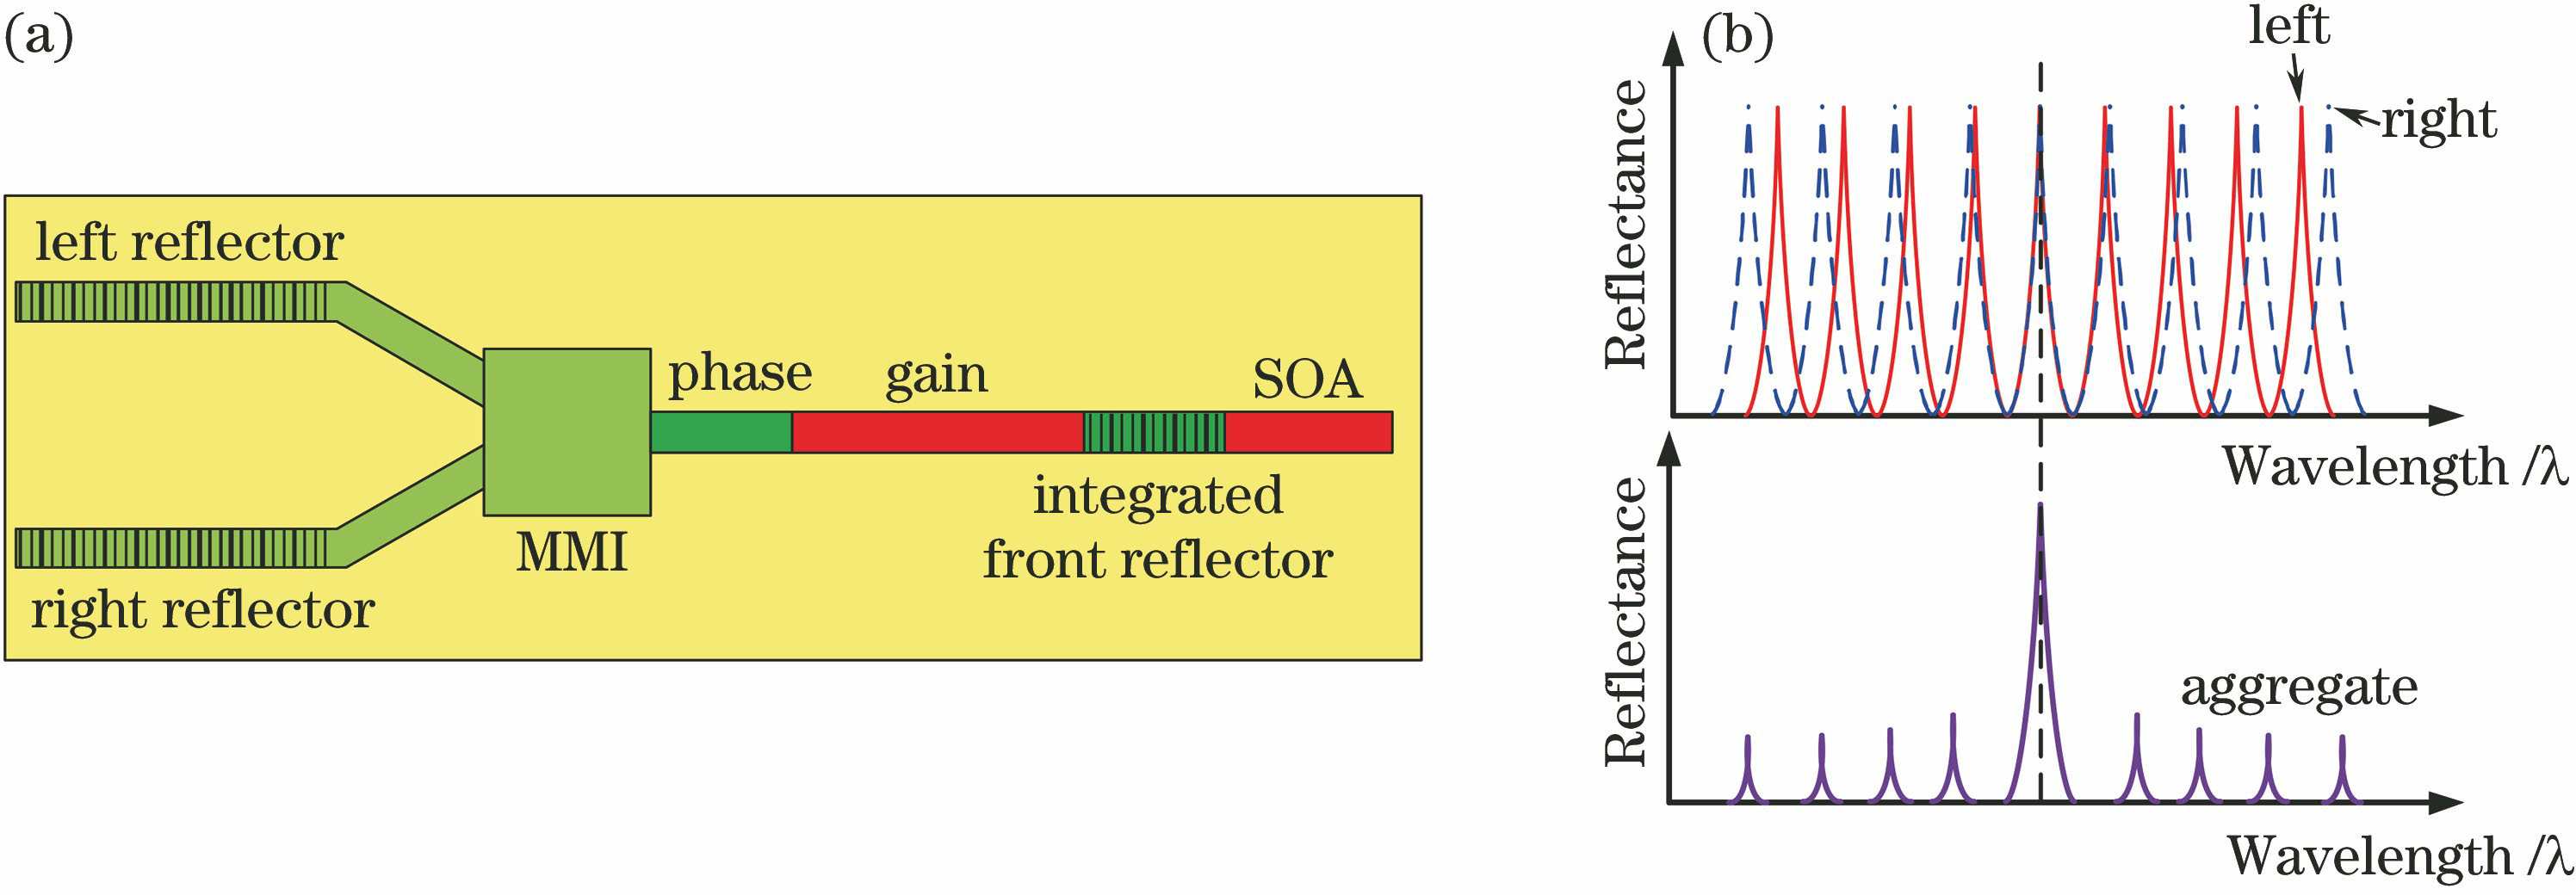
Fig. 1. MGY laser. (a) Structural diagram of laser diode; (b) tuning principle
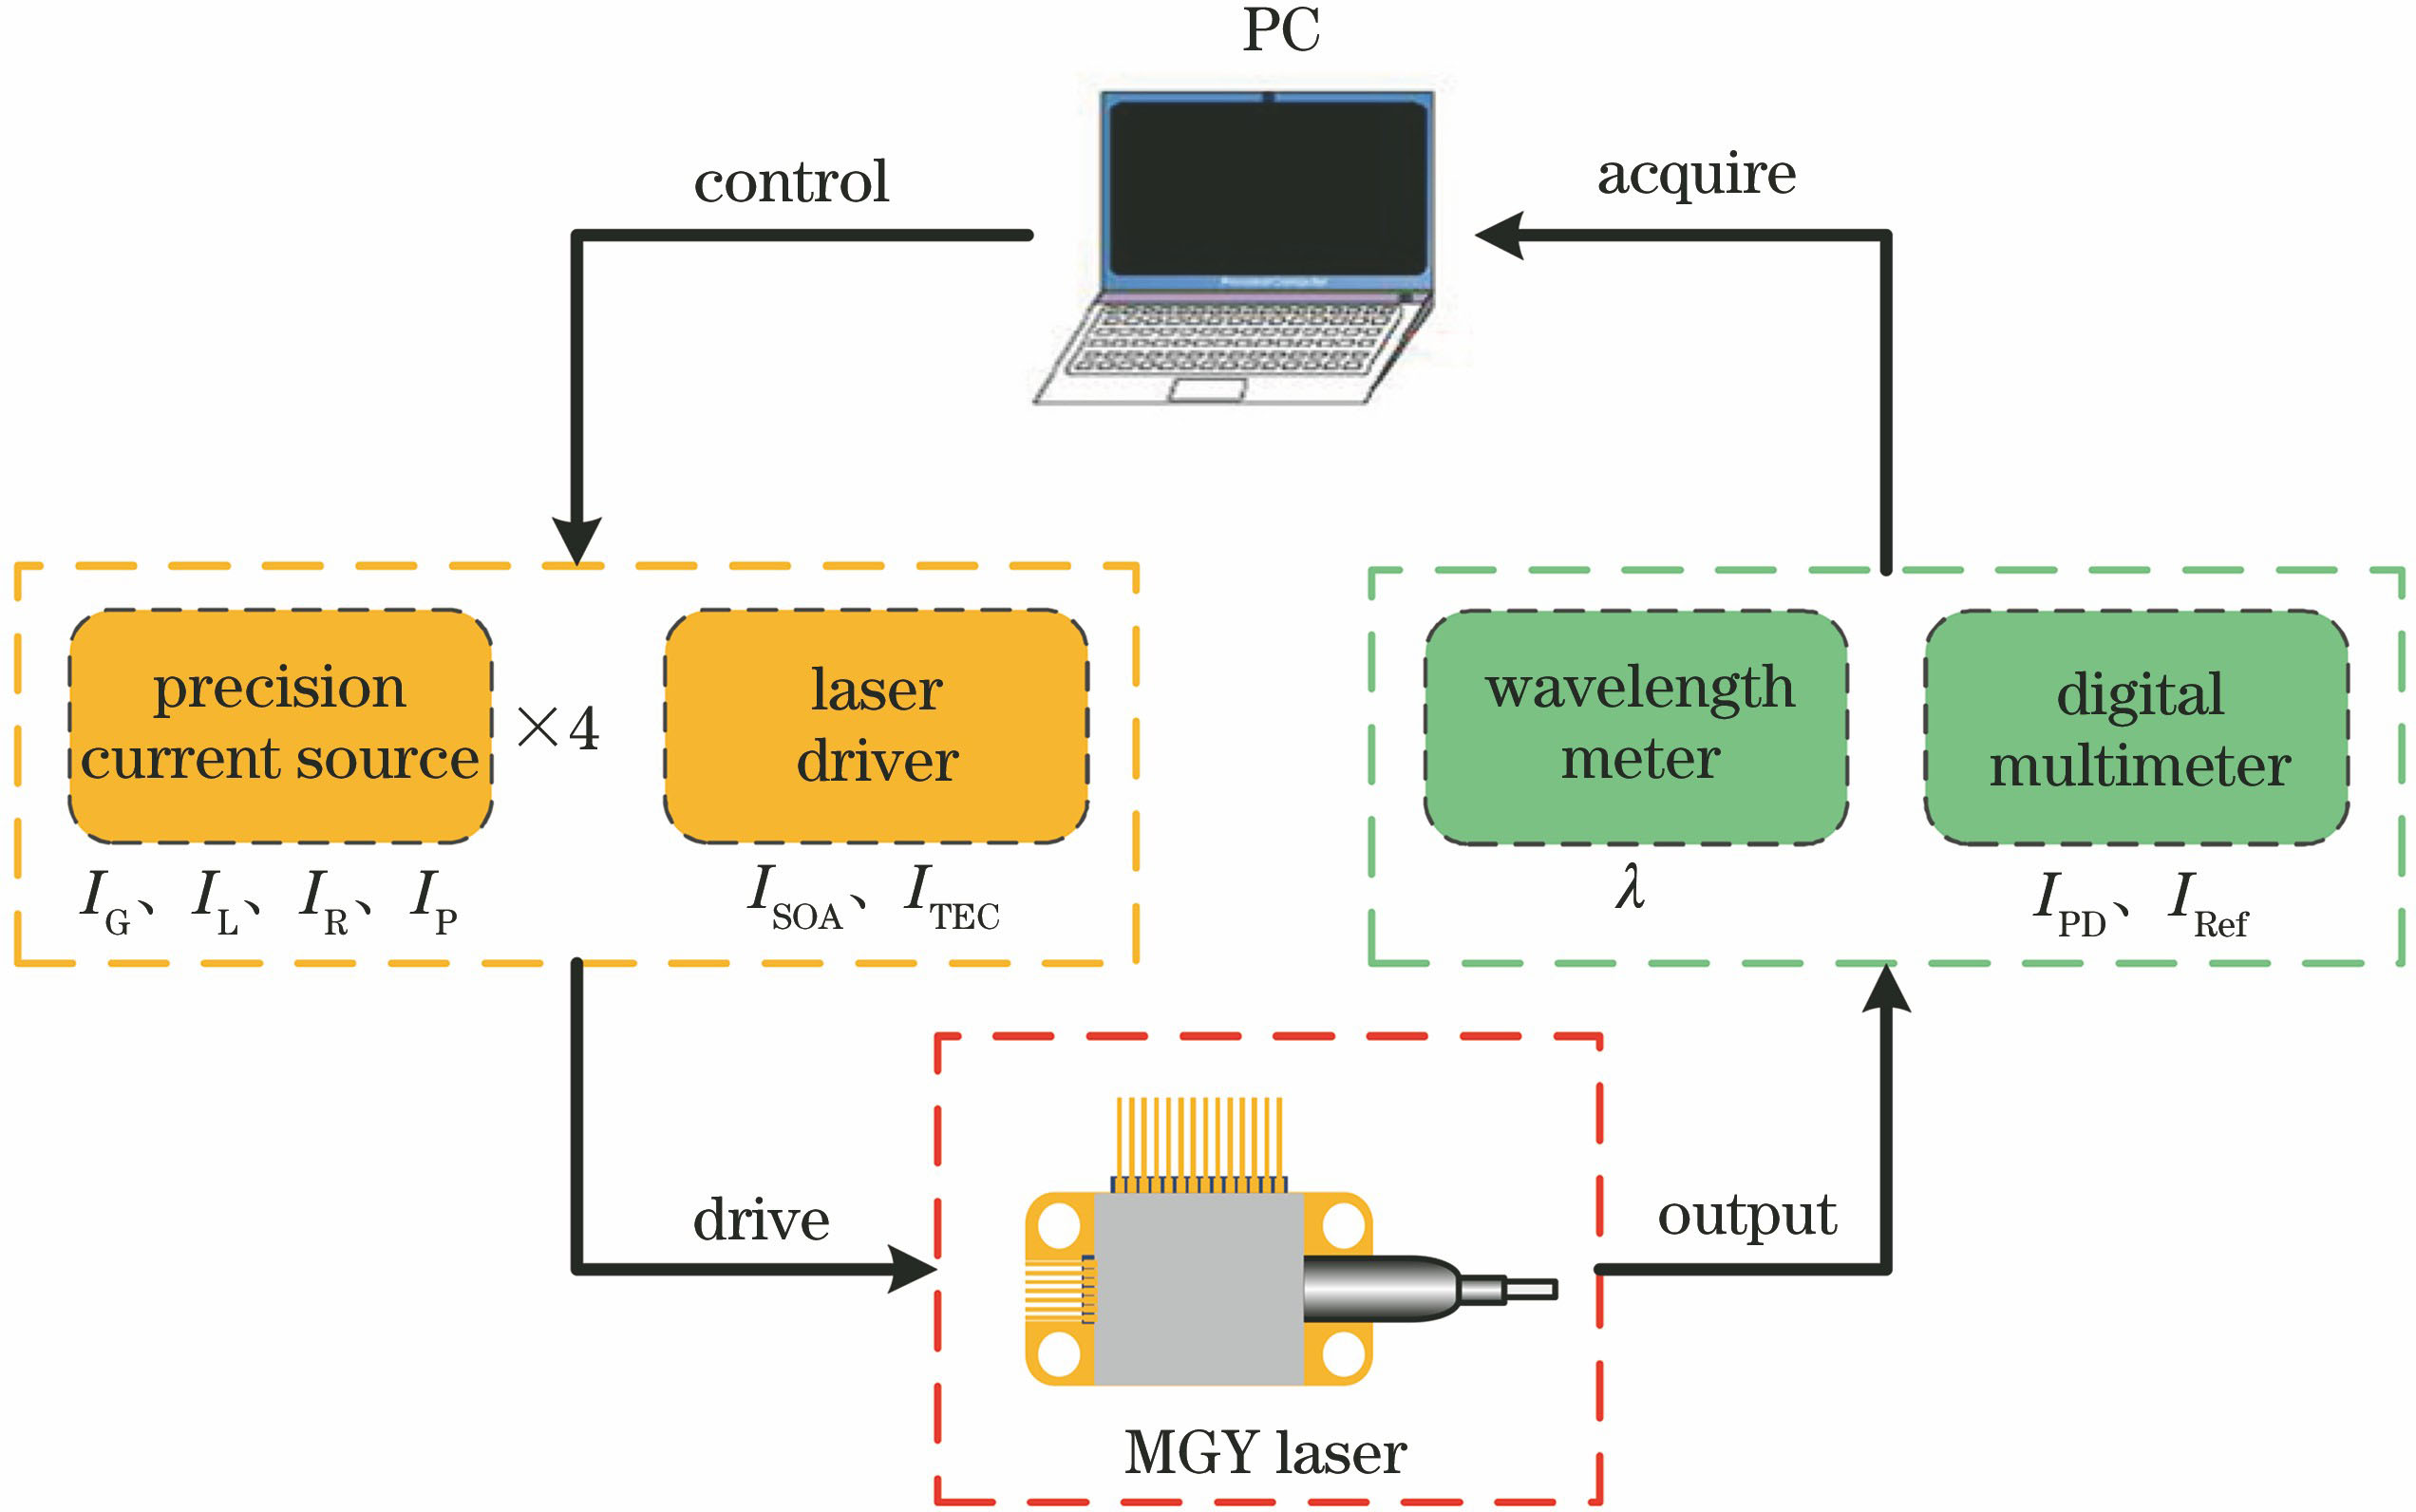
Fig. 2. Structural diagram of wavelength scanning and calibration system
Fig. 3. Tuning characteristics at left and right reflection regions. (a) Heat map of current-wavelength; (b) heat map of current-RSMSR
Fig. 4. Scanning results at phase region under different wavelengths. (a) 1540 nm; (b) 1560 nm
Fig. 5. Flow of wavelength calibration
Fig. 6. Wavelength tuning performance at normal temperature. (a) Scanning curves; (b) bias curve
Fig. 7. Internal structure of MGY laser after package
Fig. 8. Normalized transmittance of F-P etalon
Fig. 9. Set wavelength-output wavelength of laser
Fig. 10. Absorption spectrum of C2H2 gas
Fig. 11. High precision and accuracy wavelength tuning system
Fig. 12. Absorption spectra of C2H2 gas
Fig. 13. Experimental results of wavelength tuning. (a) Bias between scanning and standard curves; (b) precision and correctness curves
|
Table 1. Linear fitting results of set wavelength-output wavelength curves

Set citation alerts for the article
Please enter your email address
© Copyright 2018-2021 | Chinese Laser Press. All Rights Reserved 沪ICP备15018463号-20