
Pei Feng, Yu Li. Semiconductor Laser Parameter Inverse Design Method Based on Artificial Neural Network and Particle Swarm Optimization[J]. Chinese Journal of Lasers, 2019, 46(7): 0701001
- Chinese Journal of Lasers
- Vol. 46, Issue 7, 0701001 (2019)
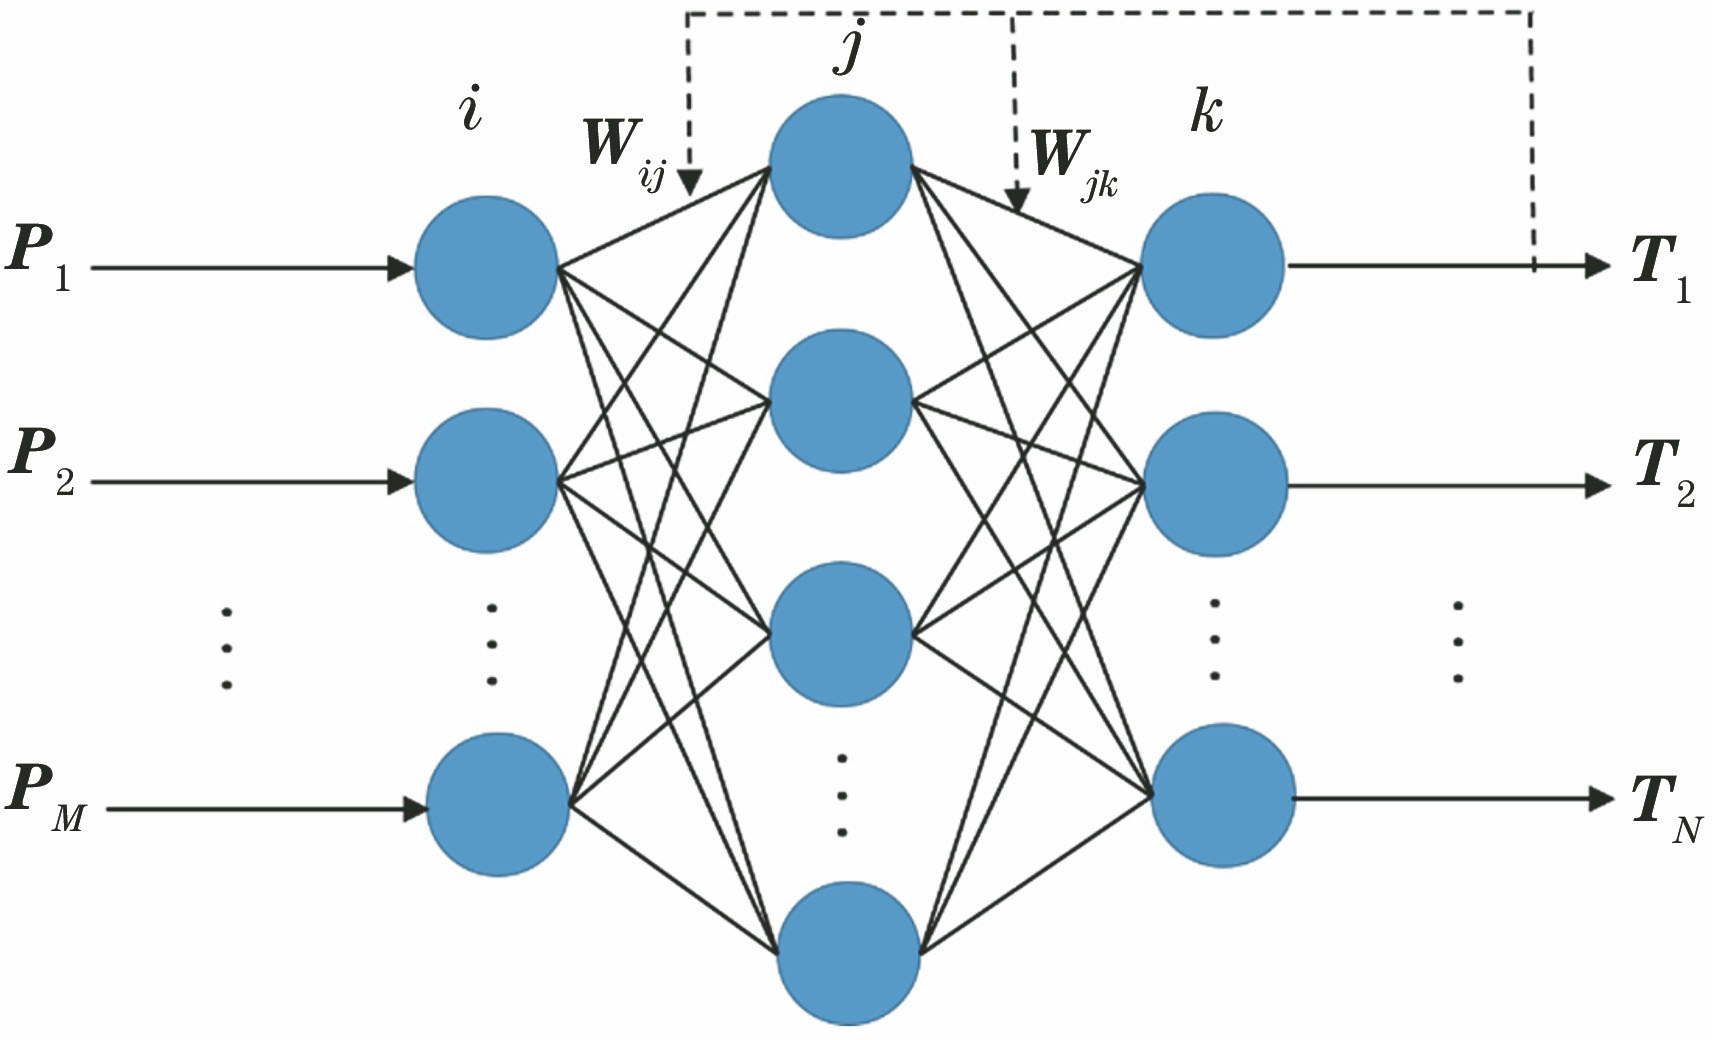
Fig. 1. Structural diagram of BP network with hidden layer
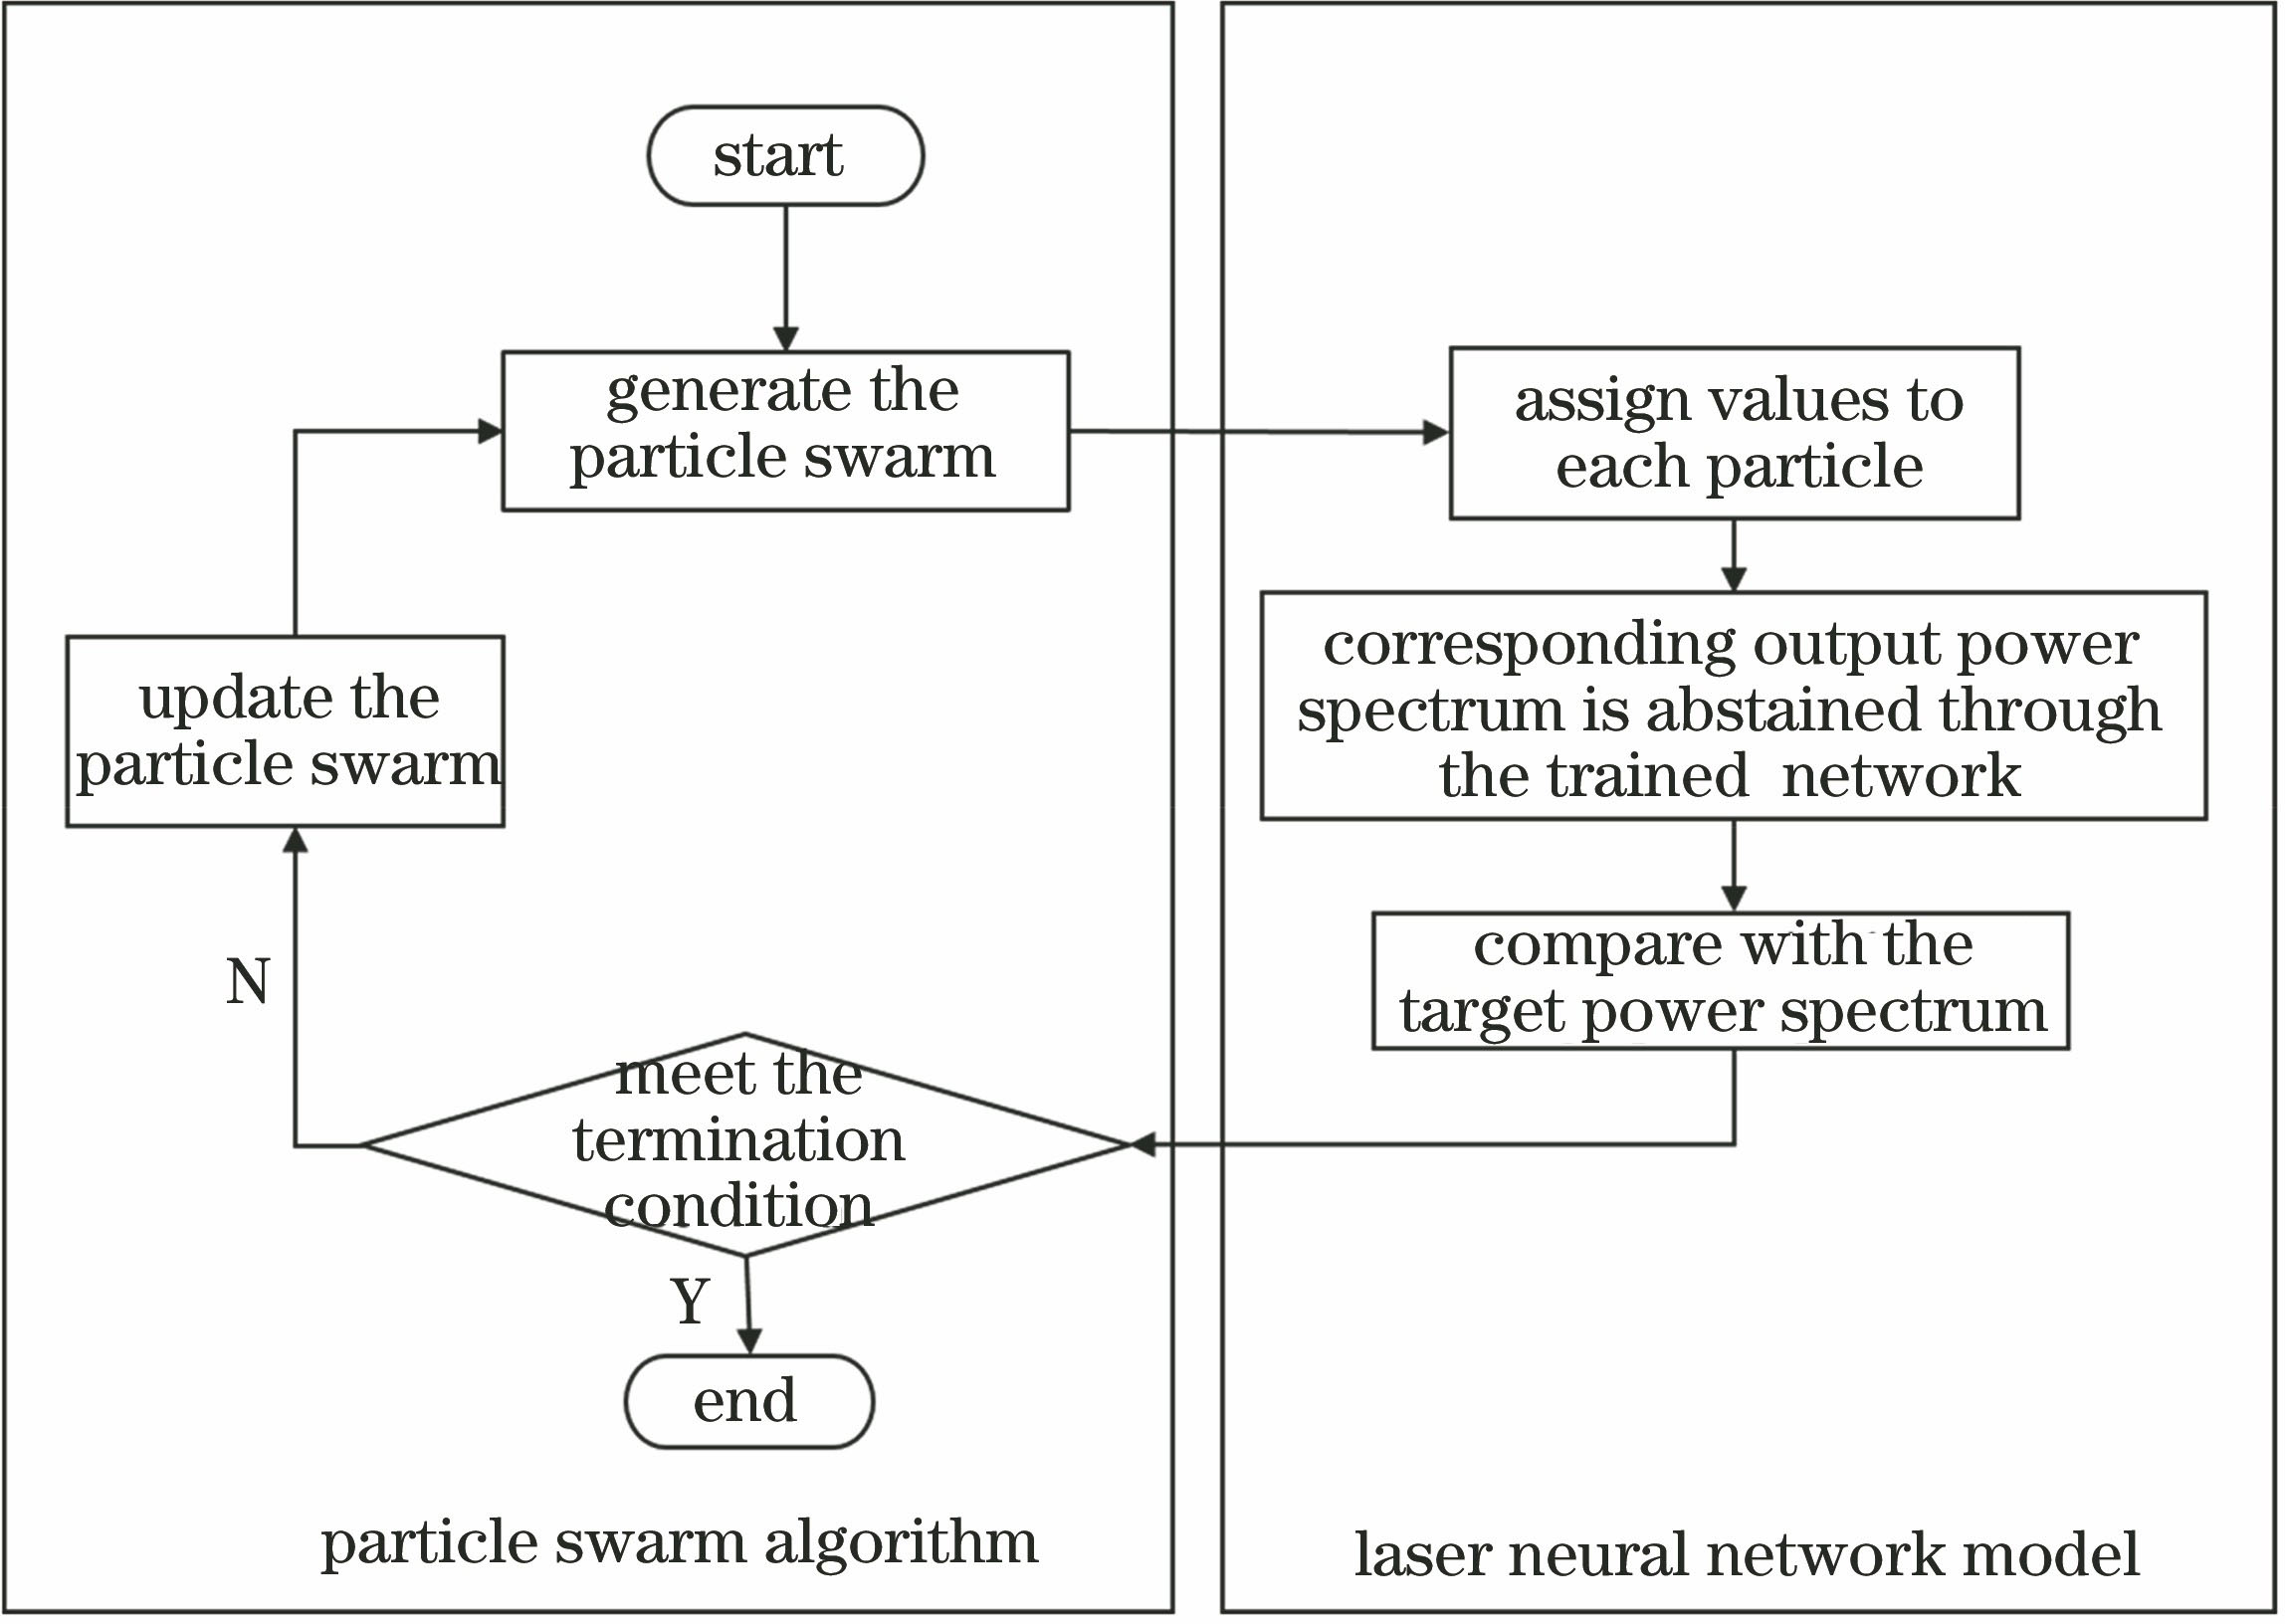
Fig. 2. Schematic of overall inverse design process
Fig. 3. Training error curve
Fig. 4. Output power spectra obtained by TWM numerical simulation and neural network for sample data
Fig. 5. Comparison of output power spectra obtained by TWM simulation and neural network for test data
Fig. 6. Schematic of searching process in PSO algorithm
Fig. 7. Comparison between inverse design power spectra and target power spectrum. (a) Comparison among two sets of inverse design power spectra, numerical inverse power spectrum, and target power spectrum; (b) deviation of two sets of inverse design power spectra and numerical inverse power spectrum compared with target power spectrum
|
Table 1. Comparison of training error between different network structures
| |||||||||||||||||||||||||||||||||||
Table 2. Comparison of partial output data between TWM simulation and neural network for sample data
| |||||||||||||||||||||||||||||||||||
Table 3. Comparison of partial output data between TWM simulation and neural network for test data
| ||||||||||||||||||||||||||||||||||||||||||
Table 4. Comparison of partial data between target power spectrum and inverse design power spectra
|
Table 5. Comparison of parameters between target power spectrum and two sets of inverse design power spectra

Set citation alerts for the article
Please enter your email address
© Copyright 2018-2021 | Chinese Laser Press. All Rights Reserved 沪ICP备15018463号-20