In the present study, a simple method for the preparation of a luminescent flexible gallium doped zinc oxide (GZO)/polystyrene nanocomposite film was developed. The prepared GZO powder was characterized through different optical and structural techniques. The XRD study revealed the existence of a wurtzite structure with no extra oxide peaks. Elemental-mapping, EDX, FTIR and XPS analyses were used to confirm the presence of elements and the several groups present in the structure. Under excitations of UV, the prepared hybrid nanocomposite showed a strong cyan emission with narrow full width at half the maximum value (20 nm) that has not been reported before. X-ray and laser-induced luminescence results of the hybrid film revealed novel blue-green emission at room temperature. The prepared composite film showed a strong scintillation response to ionizing radiation. The strong emissions, very weak deep-level emissions, and low FWHM of composite indicate the desirable optical properties with low-density structural defects in the GZO composite structure. Therefore, the prepared hybrid film can be considered to be a suitable candidate for the fabrication of optoelectronic devices.In the present study, a simple method for the preparation of a luminescent flexible gallium doped zinc oxide (GZO)/polystyrene nanocomposite film was developed. The prepared GZO powder was characterized through different optical and structural techniques. The XRD study revealed the existence of a wurtzite structure with no extra oxide peaks. Elemental-mapping, EDX, FTIR and XPS analyses were used to confirm the presence of elements and the several groups present in the structure. Under excitations of UV, the prepared hybrid nanocomposite showed a strong cyan emission with narrow full width at half the maximum value (20 nm) that has not been reported before. X-ray and laser-induced luminescence results of the hybrid film revealed novel blue-green emission at room temperature. The prepared composite film showed a strong scintillation response to ionizing radiation. The strong emissions, very weak deep-level emissions, and low FWHM of composite indicate the desirable optical properties with low-density structural defects in the GZO composite structure. Therefore, the prepared hybrid film can be considered to be a suitable candidate for the fabrication of optoelectronic devices.
Introduction
Phosphor-converted white light-emitting diodes (WLEDs) have recently attracted attention and are widely been used in a wide variety of applications, applications including energy saving, longer operating lifetimes, high luminous efficacy, and environmental friendliness[1]. Although this kind of WLEDs can produce warm white light and reduce the blue light hazard, the limitation of the full-spectrum lighting still exists. Nevertheless, a lot of scientific and technical efforts have been made to realize the full-visible-spectrum white lighting. However, there is an obvious spectrum gap appearing in the cyan region (480–520 nm) of the visible spectrum[2]. To address this issue, and efficient cyan-emitting phosphor is needed to close the cyan gap, which is indispensable to achieve high-quality lighting with ultra-high color rendering. Hence, discovering cyan-emitting phosphors that are capable of covering this gap in UV-driven LEDs is also of great importance and this is why so many efforts are made. Consequently, several cyan emitting phosphors have been developed in the last decades. Various inorganic hosts such as silicates[3,4], aluminates[5], nitrides[6,7], sulfides[8], phosphates[9], vanadates[10], and borates[11] are now available. However, compared to a large number of developed red-, green-, blue- and yellow-emitting phosphors, the quantity of cyan-emitting phosphors remains small. In this work, for the first time, we report the synthesis of highly transparent and flexible GZO/polystyrene composites (GZO/PS nanocomposite) with a narrow cyan emission band via a low-cost sol-gel method. GZO nanoparticles were synthesized by sol-gel route with 0.5 at.% of gallium and GZO particles were imbedded in polystyrene matrix by direct mixing method. The structural and optical properties of prepared nanocomposite were studied. Our results revealed that prepared samples can probably be a good candidate for use in UV-blue laser and optoelectronic devices.
Methods and characterizations
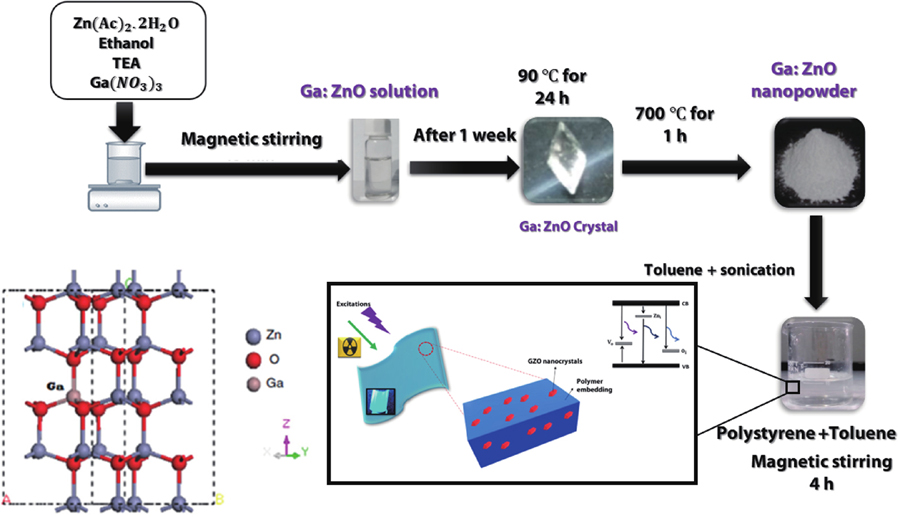
ZnO nanoparticles are synthesized according to the developed sol-gel method in our laboratory[12-15]. At first, 1 M zinc acetate dihydrate (Merck, 99.5%) was dissolved in the mixture of absolute ethanol (China, 99%) and deionized water and is kept under constant stirring for 30 min. Then triethanolamine (TEA) and 1 at.% gallium nitrate (Sigma, 99%) was added into the solution and stirred again for 1 h. Sol-gel-derived nanocrystals were dried for 2 h at 90 °C and calcined at 700 °C. Finally, 0.5 wt.% nanopowders were mixed in the polystyrene matrix. A brief process of the experimental method is shown inFig. 1.
The characterization of the prepared sample was carried out using different analytical methods. We used X-ray diffraction pattern (XRD), EDX, field emission scanning electron microscopy (FESEM), FTIR, UV–vis, and photoluminescence spectroscopy (PL). The crystallinity of synthesized GZO nanopowders was studied by an X-ray diffractometer (Panalytical). The FTIR spectrum of GZO composite was recorded using (Perkin–Elmer Model 1800) spectrometer. Morphological characteristics of prepared powder and composite were investigated using a FESEM (MIRA3TESCAN-XMU). Diffuse reflectance spectroscopy (DRS) was performed with a V-670, JASCO spectrophotometer. UV–vis spectrophotometer was used to record the transmission spectrum of the PS-GZO nanocomposite in the wavelength range of 200 to 800 nm. The PL spectrum was recorded at room temperature using a fluorescence spectrometer (PerkinElmer). X-ray luminescence spectrum was performed under continuous X-ray excitation (40 kV). An optical fiber with a diameter of 400
m, which was located at a distance of 1 cm from the sample, was used to send the emitted luminescence of the sample to the optical spectrometer.
For alpha detection investigation, prepared films (2 × 2 cm2) were coupled to the photomultiplier tube (PMT) with optical grease. The measurements were performed with setting241Am source directly (without gap) to the samples. The value of gain was set at 3 including the electronic setup with an preamplifier, amplifier, and high voltage–power supply.
The calculations of the electronic structures and DOS were performed by CASTEP code based on DFT with the GGA-PBE functional.
Results
The XRD pattern of the GZO sample is shown inFig. 2(a). The obtained result confirms that the GZO nanoparticles were crystallized with a hexagonal wurtzite structure of ZnO (JCPDS 36–1451). The prominent diffraction peaks at diffraction angles 2θ = 31.81°, 34.54°, 36.36°, can be indexed as lattice planes (100), (002) and (101), with the lattice constants (a = 0.325 nm andc = 0.5211 nm), corresponding to the wurtzite structure of ZnO. The average size of nanocrystals is estimated from three maximum intensities of (101) peak using the Debye-Scherrer formula (D = 0.9λ/βcosθ)[16]. The obtained value of the average crystallite size of GZO nanoparticles was about 30 nm. No extra peak can be seen in XRD patterns, suggesting no secondary phase exists in the GZO structure. As can also be seen inFig. 2(b), the XRD pattern of prepared GZO/PS nanocomposite presented a broad amorphous peak of PS, and crystalline diffraction peaks of ZnO. To estimate more accurate grain size from the XRD, the Williamson-Hall formula was performed:
cos
=
+ 4
sin
. A linear plot of cos
against 4sin
for the nanocomposite sample was made and the obtained results are shown inFig. 2(c). For the fit to the data, the strain (
= –0.0001) was extracted from the slope and the crystalline size was extracted from they-intercept of the fit. The size of nanoparticles was 38 nm (obtained from W–H method). No extra peak can be seen in XRD patterns, suggesting no secondary phase exists in the GZO structure. An XPS surface examination was carried out to confirm the presence of Zn, O, Ga elements in the structure (Fig. 1(d)). A strong peak at 1024 and 1044 eV was detected, which corresponds to the Zn 2p (3/2) and Zn 2p (1/2) in structure (Fig. 2(d))[15]. The small peak at 1018 eV is attributed to the Ga–O bonding in the Ga 2p (3/2) binding energy, showing that Ga has been integrated into the ZnO structure[15].
Figure 2.XRD pattern of (a) GZO nanoparticles, (b) GZO/PS hybrid nanocomposite, (c) W-H Plot of the prepared and (d) XPS survey scan of GZO nanoparticles.
The calculations are performed using the CASTEP code, which is based on density functional theory and the plane-wave pseudo-potential method[1]. This is the general gradient approximate (GGA) method[2,3] based on the density functional theory (DFT). The exchange correlation functional is the Perdew-Berk-Eernzerhof[3,4]. The interaction between cores and valence electrons is approximated by norm-conserving pseudopotentials for all elements. The relativistic effect was treated by the Koelling-Hamon approach. To model zinc oxide, the primitive ZnO cell was used as the initial structure. The plane-wave cut-off energy was 750 eV for geometry optimization and 600 eV for band-structure and DOS calculations. The resulting ZnO lattice parameters and bond length,a = 3.41 Å,c/a = 1.61, and Zn–O = 2.08 Å, are in good agreement with the experimental values ofa = 3.25 Å,c/a = 1.60, and Zn–O = 1.97 Å.Figs. 3(a)–3(d) depict the total and partial densities of states (TDOS, PDOS) of Ga-doped ZnO. It was found that the conduction band (CB) of GZO involves mostly O-p and Zn-p, Ga-p states, and the valence band (VB) mainly consist of contributions from Zn-s, O-s, O-p, and Ga-d states. To model Ga-doped crystal with d Ga, we used 443 supercells which resemble 1% atomic percentages of gallium and have 72 atoms. FT-IR analysis was also performed to evaluate the chemical bonding of GZO and the result can be seen inFig. 3(e). As can be seen in the FTIR spectrum (Fig. 2), there are several strong peaks around ~400–500 cm–1 which correspond to hexagonal ZnO and confirm the formation of ZnO[17]. C–N peaks that appeared at 1070–1117 cm–1 are related to the reaction of TEA with zinc acetate[18]. The peaks at ~1600, 1900, and 1450 cm–1 are related to characteristic vibration bands of aromatic C–C contributing from TEA[19]. The peaks at the range of 2800 to 2900 cm–1 correspond to the asymmetric and symmetric stretching vibrations of –CH2, respectively. The peaks ranging from 2800 to 3300 cm–1 are assigned to aromatic C–H stretching vibrations[20]. Another strong peak at 3400 cm–1 shows the presence of hydrogen-bonded groups in the sample (OH). The size distribution and morphology of the GZO nanoparticles were investigated using field emission scanning electron microscopy (Figs. 4(a)–4(d)). As can be seen in the SEM images of the prepared GZO sample (Figs. 3(a)–3(c)), the sol-gel-derived GZO nanoparticles have both spherical and rod shapes. According to the figures, the average particle size of the GZO nanopowders is nearly 251 nm. For identifying the chemical composition of prepared nanoparticles, energy–dispersive X-ray spectroscopy was performed. According toFig. 5(a), the existence of Zn, O, and Ga elements in the prepared GZO nanocrystals was confirmed. The EDX spectrum shows the atomic percentage values of zinc (72.25%), oxygen (27.25%) and gallium (0.5%) respectively. The mapping elemental of the GZO/PS composite sample confirmed the elements of Zn, O, C and Ga which were uniformly distributed in the prepared flexible film (Fig. 5(b)).
Figure 3.(Color online) (a–d) Total and partial density of states for Ga:ZnO, and (e) FTIR pattern of GZO hybrid composite.
The EDX spectrum is presented inFig. 5(a). The mapping elemental of GZO/PS composite film is illustrated inFig. 4(b). A plot of band gap energy for GZO powders is provided inFig. 6(a). The optical bandgap of GZO powders was received by UV–vis diffuse reflectance and photoluminescence spectroscopy. The band gap energy of the prepared powders was calculated by Kubelka– Munk equation[21]:
Figure 6.(Color online) (a) Plot of band gap energy and (b) photoluminescent spectrum of GZO powders.
HereR is the reflectance. According to theFig. 6(a), by plotting (F(R)×E)2 as a function of energy, the value of the band gap for GZO powder was obtained about 3.3 eV, which is attributed to an increase in particle size and oxygen vacancy concentration[22]. The PL spectrum of colloidal GZO is shown inFig. 6(b). The PL spectrum consists of a sharp strong peak at 370 nm in UV region and very weak peaks in visible region. The main emissions of ZnO in PL spectrum are attributed to near band edge emission (NBE) and deep level emission (DLE). The strong UV emission is attributed to recombination of excitons through donor bound excitons (DBE), bands of donor states, biexcitons (BE), and exciton-phonon collision process[23-25]. Also, the mechanism of the DLE emissions mostly relates to intrinsic defects and crystalline defects such as oxygen vacancy, Zn interstitials, oxygen vacancy, zinc vacancy interstitial zinc, and interstitial oxygen.Figs. 7(a) and7(b) show the transparency and SEM images from the surface and cross-sectional view of the GZO/PS nanocomposite film. The transmission spectrum for GZO/PS nanocomposite is shown in the inset ofFig. 7(a). The prepared GZO/PS nanocomposite exhibited above 70% transparency in the visible region. According toFig. 7(a) good distribution and low agglomeration of nanoparticles can be observed in the GZO/PS nanocomposite which has an important effect on the transparency and optical properties of GZO/PS nanocomposite. According toFig. 7(b) and the high resolution of SEM image, it is observed that GZO nanoparticles (as filler material) are dispersed well in a polymeric matrix.Fig. 8(a), shows the room temperature recorded photoluminescence spectrum of GZO/PS nanocomposite upon theλex= 230 nm. For the first time, it has been found that the prepared GZO/PS nanocomposite can emit a strong cyan emission at ~480 nm with a very low full width at half maximum value (20 nm). A strong cyan emission at room temperature (
= 230 nm) is due to donor–acceptor pairs in recombination among various intrinsic and extrinsic defects. The existence of different donor levels corresponding to Ga3+ leads to the change of trap level energy position. According to the charge compensation and its neutrality in the lattice of ZnO (two Ga3+ ions substitute for three Zn2+ ions), one Zn2+ vacancy for incorporation of each two Ga3+ ions can be created. In addition, one oxygen interstitial (Oi2) defect can be formed, and there is possibility that the electrons from an intrinsic donor level to the VZn acceptor center are recombined. These phenomena give rise to cyan emission[19]. Using two different excitation wavelengths the photoluminescence measurement was performed at room temperature for GZO/PS sample. The obtained results are shown inFig. 8(d). As can be found from this figure, several peaks of PL measurement observed at 320, 360, 393, 450 and 525 nm for two various excitation wavelengths. From the PL measurement, it can be seen that the best excitation in UV range for GZO/PS sample is 230 nm with a strong and single visible emission. It should be mentioned that although our PL instrument in our region had limitations and could not be evaluated any data <0.01 ms, we tried to estimate the luminescence decay time of the prepared nanocomposite. To measure the luminescence decay time of the prepared flexible film, the PL spectra at different time intervals were investigated (Fig. 7(c)). According to Eq. (2):
Figure 7.(Color online) FESEM surface image of GZO/polystyrene nanocomposite.
Figure 8.(Color online) PL spectrum of (a) GZO/PS nanocomposite and (b) bare PS composite. (c) ln(I) versus time and mission spectra of GZO/PS sample at different time spaces and (d) excited at different excitation wavelengths.
whereI is the area under PL’s curves,
is the area under PL curve att = 0,t is interval time after blocking the excitation lamp, andτ is decay time. By plotting ln(I) vs time (Fig. 8(c)), the slope of the curve equals –1/τ. Therefore, the value of calculatedτ is 38μs. Therefore, it appears that oxide luminescent thin-film composites are a better form to apply in displays. In addition, the energy transfer efficiency (ƞ) could be obtained using Eq. (3)[20]:
where
is the lifetime of GZO composite film and
is the lifetime of the pure PS film. Energy transfer efficiency of the prepared sample was measured according to Eqs. (2) and (3) and obtained to be
~
90.23%. In similar study, the hybrid ZnO nanoparticle and anthracene embedded polyphenylsiloxane (PPS) glass films was obtained to be 90%[20]. The experimental results show that the color purity will be enhanced using the optimization of type, dose of resins, and dispersing nanoparticles in the composites. To improve the display quality of full-color displays, it is important to increase the variety of phosphor colors that are located out of the special three-color area (red, green, and blue). For example, cyan emission is one of the most promising candidates for this purpose, which can enhance the color gamut and improve the display quality. Developing phosphors with high color purity is an important strategy to improve display quality. To enhance the display quality, and therefore suitable color system phosphors is needed. Cyan fluorescent agents are ideal for simultaneous detection of two or more events in the cell population, multicolor labeling, and bio applications. Powder shape materials are the most common form of phosphors. Morphology, composition, surface, and size of particles have great effects on the luminescence properties. Most processes of powder preparation might result in a damage of luminescent performance of nanoparticles due to serious aggregation and irregular shapes, but soft chemical methods such as sol-gel derived powders with better morphology and controllable shapes decrease the light scattering and non-radiative transitions which are enhancing luminescent efficiency. Simple strategy to illustrate the possible increasing mechanism of luminescent efficiency is composition modification. There are several routes to maintain and increase luminescent properties in photonic applications. For example, one is to mix luminescent powders with transparent polymer matrices. Generally, in a solid-state emitter material in addition to bandgap emission, an intense and broad defect emission in the visible region can be observed that reduces the quantum efficiency for optoelectronic applications. It is important to have high quantum efficiency without energy loss to these defects. So, the control of defects by controlling the synthesis process is very important issue for the improvement of emission efficiency. Luminescence spectrum of the neat PS and prepared nanocomposite together is shown inFigs. 8(a) and8(b). While the spectrum of neat PS does not show specific characteristic emission peaks in blue-green region, prepared nanocomposite exhibits strong luminescence peaks. As can be found inFig. 8(a), GZO/PS nanocomposite emitted a strong violet–blue peak at 400–420 nm wavelengths which are due to the oxygen vacancy, recombination of a photoexcited hole, and the singly ionized-charge oxygen vacancy that are the main mechanisms of the blue emission in ZnO structure[26-29]. Because of the low formation enthalpy of oxygen vacancies, they can easily be formed and provide a pathway for occurring of the radiative recombination between the vacancies and electron–hole[26-29]. A weak UV peak at 375 nm can also be found inFig. 8(c). It is reported that the strong violet emission is attributed to the electron transition from the interstitial zinc levels to the valence band and show a high concentration of Zn interstitial defect on the surface[26-29]. PL results from samples confirmed that prepared samples are good candidates for use in UV–blue laser and photonic applications.Figs. 9(a) and9(b) shows the schematic of the experimental setup and luminescence spectrum of GZO/PS sample under CW Nd:YAG laser excitation (1064 nm). A schematic diagram for the mechanisms of the emission due to GZO/PS nanoparticles is shown inFig. 9(c). The PL spectrum of the CW laser-excited prepared sample showed four main peaks in the blue-green region due to the upconversion photon processes in the ZnO host. PL results from samples confirmed that prepared samples are good candidates for use in UV-blue laser and photonic applications[12-15,29-32]. For scintillation investigation of the prepared hybrid film, X-ray induced luminescence study was performed (Fig. 9(c)). As shown inFig. 9(c), the PL spectrum of the f film shows a strong peak at 490 nm in the blue-green region. Laser/UV and ion beam excitations of valence band electrons to the conduction band yields valence band holes. Then, electrons from the donor levels and excited electrons from the conduction band drop into the holes, releasing energy as UV, purple, and blue-green light. UV light emission is due to the near band edge electron transition between the conduction and valence bands, indicating a bandgap of ZnO nanostructures[30-34], which causes deep bandgap levels. The incident laser/irradiation creates holes in the upper 3d and sp-conduction bands above Fermi level (EF)[30]. Free electrons at the EF can quickly descend into holes, emitting UV and visible light. The low-intensity wide band represents electron transitions from conduction to valence bands, causing blue-to-red visible light emissions. Zn defects can offer a significant number of free electrons at the EF level for electron transfer to ZnO portions, modifying PL emissions[30]. Blue-cyan and green peaks result from oxygen vacancies and ionized oxygen vacancies transitioning to the ZnO's valance band. Also, it can be said that the peak at 450–550 nm comes from the electron migration from the conduction band to the ionized zinc vacancy (CB
)[34]. In a similar report, radioluminescence of the ZnO:Ga-PS pellet showed strong emission peak at 391 nm[34].
Figure 9.(Color online) (a) Schematic of the experimental setup of CW laser excitation. (b) PL spectrum under excitation at 325 nm. (c) X-ray luminescence. (d) Schematic diagram for the mechanisms of the emission. (e) Height pulse spectra of GZO hybrid film.
To investigate the radiation detection potential of synthesized hybrid film, an241Am source with activity of 0.09
c was used as the alpha particles source (setup experiment is observed in the inset ofFig. 9(e)). The height pulse spectra of bare PS as background and GZO hybrid film are shown inFig. 9(e). It is clear that GZO filler plays an important role in detection response and counting rate. By introducing GZO nanoparticles in hybrid film, the position and intensity of the central peak (count rate) were increased. Indeed, an enhancement of interaction between nanoparticle and alpha particles resulted in an increase of scintillation light.
Stability is an important key factor in evaluating material attributes for practical application. The luminescence stability of the constructed polymer-based GZO film was investigated after 3 days floating in water under UV irradiation. As demonstrated inFigs. 10(a) and10(b) GZO nanocomposite sample after 3 days still maintained more than 80% of its luminous property.
Figure 10.(Color online) (a, b) The relative PL intensity of composite depending on time, after 3 days of water immersion.
In summary, Ga:ZnO nanoparticles were successfully synthesized by the simple sol-gel route and GZO hybrid nanocomposite was prepared by a low-cost method. The prepared nanocomposite showed a strong blue emission at ~480 nm with a very low full width at half maximum value (20 nm). The flexible GZO/PS nanocomposite showed acceptable transparency, strong photosensitivity to UV, laser, alpha, and X-ray irradiation, with good distribution and low agglomeration of nanoparticles. The presence of gallium and related chemical bonding was confirmed in the GZO structure. The present investigation suggests that the produced high-quality samples are potentially useful for optical applications.
[16] S Ilican, Y Caglar, M Caglar. Preparation and characterization of ZnO thin films deposited by sol-gel spin coating method. J Optoelectron Adv Mater, 10, 2578(2008).