• Chinese Journal of Chemical Physics
  • Vol. 33, Issue 5, 547 (2020)
Zhen Chi1、3, Hui-hui Chen2, Zhuo Chen2, and Hai-long Chen1、4、*
Author Affiliations
  • 1The Laboratory of Soft Matter Physics, Beijing National Laboratory for Condensed Matter Physics, Institute of Physics, Chinese Academy of Sciences, Beijing 100190, China
  • 2Department of Materials Physics and Chemistry, Beijing Key Laboratory of Construction Tailorable Advanced Functional Materials and Green Applications, School of Materials Science and Engineering, Beijing Institute of Technology Institution, Beijing 100081, China
  • 3Institute of Photo-biophysics, School of Physics and Electronics, Henan University, Kaifeng 475004, China
  • 4Songshan Lake Materials Laboratory, Dongguan 523808, China
  • show less
    DOI: 10.1063/1674-0068/cjcp2007123 Cite this Article
    Zhen Chi, Hui-hui Chen, Zhuo Chen, Hai-long Chen. Unveiling Defect-Mediated Carrier Dynamics in Few-Layer MoS2 Prepared by Ion Exchange Method via Ultrafast Vis-NIR-MIR Spectroscopy[J]. Chinese Journal of Chemical Physics, 2020, 33(5): 547 Copy Citation Text show less
    (a) Absorption spectrum of MoS2 nanosheets on calcium fluoride window with A-, B-, and C-exciton features labeled. (b) Raman spectrum of MoS2 nanosheets showing two prominent modes as labeled. Open circles are the experimental points, and solid lines are the Gauss fits. (c) AFM image of MoS2 nanosheets; the inset is the height profile of the AFM image for three nanosheets.
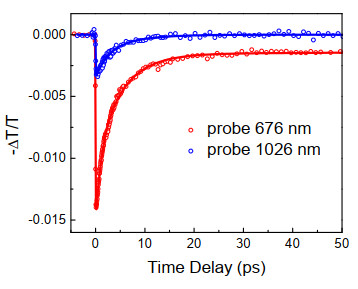
    Fig. 1. (a) Absorption spectrum of MoS2 nanosheets on calcium fluoride window with A-, B-, and C-exciton features labeled. (b) Raman spectrum of MoS2 nanosheets showing two prominent modes as labeled. Open circles are the experimental points, and solid lines are the Gauss fits. (c) AFM image of MoS2 nanosheets; the inset is the height profile of the AFM image for three nanosheets.
    Temporal evolution of excitation-induced transmission change for the few-layer MoS2 nanosheets detected at 676 nm and 1026 nm, under the excitation of 676 nm (89μJ/cm2).
    Fig. 1. Temporal evolution of excitation-induced transmission change for the few-layer MoS2 nanosheets detected at 676 nm and 1026 nm, under the excitation of 676 nm (89μJ/cm2).
    Normalized temporal evolution of excitation-induced transmission change for the few-layer MoS2 detected at 676 nm, under the excitation of 676 nm with pump fluences of 38 and 89 μJ/cm2. The slow decay component that can last hundreds of picoseconds is strongly dependent on the pump fluence, which can be attributed to the thermalization of MoS2 lattice.
    Fig. 2. Normalized temporal evolution of excitation-induced transmission change for the few-layer MoS2 detected at 676 nm, under the excitation of 676 nm with pump fluences of 38 and 89 μJ/cm2. The slow decay component that can last hundreds of picoseconds is strongly dependent on the pump fluence, which can be attributed to the thermalization of MoS2 lattice.
    Waiting time (\begin{document}$ t_ \rm{w} $\end{document}) dependent TA spectra in (a) visible and (b) NIR regions for the few-layer MoS2 nanosheets after photoexcitation at 676 nm with the pump fluence of 89 μJ/cm2. (c) TA spectra at 0.2 ps time delay extracted from FIG. 2(a) (blue line) and FIG. 2(b) (red line). (d) Extracted temporal evolution of excitation-induced transmission change detected at 676 nm and 1026 nm. Dots are data, and curves are multi-exponential fitting with the consideration of instrument response function (~150 fs).
    Fig. 2. Waiting time (\begin{document}$ t_ \rm{w} $\end{document}) dependent TA spectra in (a) visible and (b) NIR regions for the few-layer MoS2 nanosheets after photoexcitation at 676 nm with the pump fluence of 89 μJ/cm2. (c) TA spectra at 0.2 ps time delay extracted from FIG. 2(a) (blue line) and FIG. 2(b) (red line). (d) Extracted temporal evolution of excitation-induced transmission change detected at 676 nm and 1026 nm. Dots are data, and curves are multi-exponential fitting with the consideration of instrument response function (~150 fs).
    (a) Temporal evolution of excitation-induced transmission change of few-layer MoS2 detected at 1026 nm, under the excitation of 676 nm with different pump fluences. Circles are data, and curves are bi-exponential fitting. (b) The excitation-induced peak amplitude (orange balls, left vertical axis) and the fitted time constants (red and green balls, right vertical axis) as the function of incident pump fluence
    Fig. 3. (a) Temporal evolution of excitation-induced transmission change of few-layer MoS2 detected at 1026 nm, under the excitation of 676 nm with different pump fluences. Circles are data, and curves are bi-exponential fitting. (b) The excitation-induced peak amplitude (orange balls, left vertical axis) and the fitted time constants (red and green balls, right vertical axis) as the function of incident pump fluence
    (a) Transient absorption (TA) spectra at 0.6 ps time delay for the few-layer MoS2 after photoexcitation at 400 nm. The pump fluences are 110 μJ/cm2 for the visible probe and 50 μJ/cm2 for the NIR probe. (b) Temporal evolution of excitation-induced transmission change detected at 676 nm and 1026 nm under the excitation of 400 nm. Dots are data, and curves are multi-exponential fitting with the consideration of instrument response function (~150 fs).
    Fig. 3. (a) Transient absorption (TA) spectra at 0.6 ps time delay for the few-layer MoS2 after photoexcitation at 400 nm. The pump fluences are 110 μJ/cm2 for the visible probe and 50 μJ/cm2 for the NIR probe. (b) Temporal evolution of excitation-induced transmission change detected at 676 nm and 1026 nm under the excitation of 400 nm. Dots are data, and curves are multi-exponential fitting with the consideration of instrument response function (~150 fs).
    (a) A schematic illustration of photoinduced carrier relaxation processes in few-layer MoS2. The blue solid lines and green dotted line indicate the mid-gap states and Fermi level (\begin{document}$ E_ \rm{F} $\end{document}), respectively. The yellow and red vertical arrows indicate the initial excitation with 676 nm and 1150 nm pump pulses, respectively. The red dashed vertical arrows indicate the NIR and MIR probe pulses. The wavy gray arrows illustrate different relaxation processes: (1) trap of carriers by defect states and (2) nonradiative recombination of trapped carries via defect-mediated processes. (b) and (c) Temporal evolution of excitation-induced absorption change of MoS2 detected at 3500 nm, under the excitation of (b) 676 nm with a pump fluence of 100 μJ/cm\begin{document}$ ^2 $\end{document}, and (c) 1150 nm with a pump fluence of 1.2 mJ/cm\begin{document}$ ^2 $\end{document}. Circles are data and curves are exponential fitting. (d) Normalized temporal evolution of excitation-induced absorption change of MoS2 detected at different wavelengths, under the excitation of 676 nm with a pump fluence of 100 μJ/cm\begin{document}$ ^2 $\end{document}. Circles are data and curves are global fitting results. (e) MIR TA spectra at four typical time delays. The TA spectrum at 0.16 ps is fitted in the form of \begin{document}$ \lambda^2 $\end{document} (gray dashed line). The distortion of the spectrum close to 4260 nm is caused by the light absorption of CO2 in the atmosphere. (f) Decay associated difference spectrum corresponding to the 10.2 ps slow decay component, which was obtained from the global fitting analysis for the MIR TA data. The orange arrow indicates the position of the spectrum converting from negative to positive.
    Fig. 4. (a) A schematic illustration of photoinduced carrier relaxation processes in few-layer MoS2. The blue solid lines and green dotted line indicate the mid-gap states and Fermi level (\begin{document}$ E_ \rm{F} $\end{document}), respectively. The yellow and red vertical arrows indicate the initial excitation with 676 nm and 1150 nm pump pulses, respectively. The red dashed vertical arrows indicate the NIR and MIR probe pulses. The wavy gray arrows illustrate different relaxation processes: (1) trap of carriers by defect states and (2) nonradiative recombination of trapped carries via defect-mediated processes. (b) and (c) Temporal evolution of excitation-induced absorption change of MoS2 detected at 3500 nm, under the excitation of (b) 676 nm with a pump fluence of 100 μJ/cm\begin{document}$ ^2 $\end{document}, and (c) 1150 nm with a pump fluence of 1.2 mJ/cm\begin{document}$ ^2 $\end{document}. Circles are data and curves are exponential fitting. (d) Normalized temporal evolution of excitation-induced absorption change of MoS2 detected at different wavelengths, under the excitation of 676 nm with a pump fluence of 100 μJ/cm\begin{document}$ ^2 $\end{document}. Circles are data and curves are global fitting results. (e) MIR TA spectra at four typical time delays. The TA spectrum at 0.16 ps is fitted in the form of \begin{document}$ \lambda^2 $\end{document} (gray dashed line). The distortion of the spectrum close to 4260 nm is caused by the light absorption of CO2 in the atmosphere. (f) Decay associated difference spectrum corresponding to the 10.2 ps slow decay component, which was obtained from the global fitting analysis for the MIR TA data. The orange arrow indicates the position of the spectrum converting from negative to positive.
    Temporal evolution of excitation-induced transmission change for the few-layer MoS2 detected at 676 nm, under the excitation of 400 nm with different pump fluences.
    Fig. 4. Temporal evolution of excitation-induced transmission change for the few-layer MoS2 detected at 676 nm, under the excitation of 400 nm with different pump fluences.
    (a) Temporal evolution of excitation-induced transmission change for the few-layer MoS2 detected at 1026 nm, under the excitation of 400 nm with different pump fluences. Circles are data, and curves are multi-exponential fitting with the consideration of instrument response function (~150 fs).
    Fig. 5. (a) Temporal evolution of excitation-induced transmission change for the few-layer MoS2 detected at 1026 nm, under the excitation of 400 nm with different pump fluences. Circles are data, and curves are multi-exponential fitting with the consideration of instrument response function (~150 fs).
    Results of global fitting analysis for the MIR TA data with three exponential decay functions showing (a) three exponential decay dynamics with time constants 0.7 ps, 3.1 ps and 10.2 ps, respectively, and (b) three corresponding decay associated difference spectra (DADS). The data was collected under the excitation of 676 nm with a pump fluence of 100 μJ/cm2.
    Fig. 6. Results of global fitting analysis for the MIR TA data with three exponential decay functions showing (a) three exponential decay dynamics with time constants 0.7 ps, 3.1 ps and 10.2 ps, respectively, and (b) three corresponding decay associated difference spectra (DADS). The data was collected under the excitation of 676 nm with a pump fluence of 100 μJ/cm2.
    Table 1. Fitted time constants for decay curves (-ΔT/T) in Figure S5.
    Zhen Chi, Hui-hui Chen, Zhuo Chen, Hai-long Chen. Unveiling Defect-Mediated Carrier Dynamics in Few-Layer MoS2 Prepared by Ion Exchange Method via Ultrafast Vis-NIR-MIR Spectroscopy[J]. Chinese Journal of Chemical Physics, 2020, 33(5): 547
    Download Citation