• Journal of Atmospheric and Environmental Optics
  • Vol. 18, Issue 5, 434 (2023)
BAO Xulun1, LI Yi2、*, Hu Yiwen2、3, WANG Yang4, NIU Dan5, ZANG Zengliang2, and CHEN Xisong5
Author Affiliations
  • 1School of Software, Southeast University, Suzhou 215123, China
  • 2College of Meteorology and Oceanography, National University of Defense Technology, Changsha 410000, China
  • 3College of Atmospheric Sciences, Nanjing University of Information Science & Technology, Nanjing 210044, China
  • 4Beijing Hongxiang Technology Co., LTD, Beijing 100089, China
  • 5School of Automation, Southeast University, Nanjing 211189, China
  • show less
    DOI: 10.3969/j.issn.1673-6141.2023.05.004 Cite this Article
    Xulun BAO, Yi LI, Yiwen Hu, Yang WANG, Dan NIU, Zengliang ZANG, Xisong CHEN. Atmospheric visibility prediction method based on ConvLSTM and PredRNN[J]. Journal of Atmospheric and Environmental Optics, 2023, 18(5): 434 Copy Citation Text show less
    Structure diagram of LSTM (a) and ST-LSTM (b)
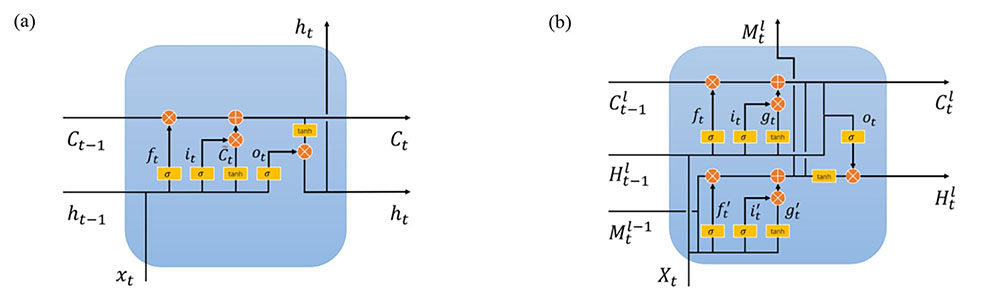
    Fig. 1. Structure diagram of LSTM (a) and ST-LSTM (b)
    Structure diagram of ConvLSTM (a) and PredRNN (b)
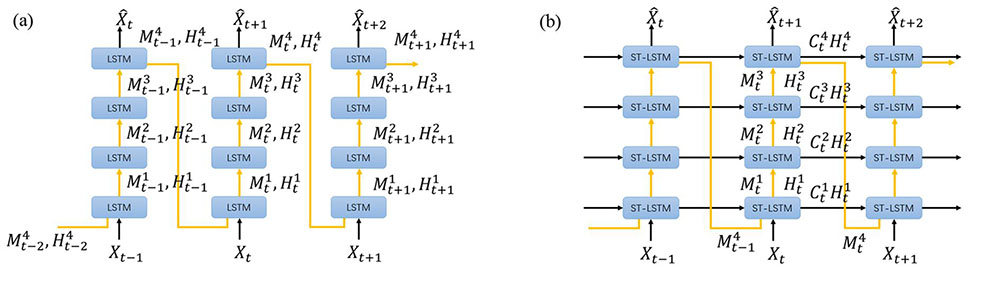
    Fig. 2. Structure diagram of ConvLSTM (a) and PredRNN (b)
    Visibility field map at 00:00, September 14, 2020
    Fig. 3. Visibility field map at 00:00, September 14, 2020
    Example of weather forecast from 12:00 to 17:00, September 14, 2020. (a) True value; (b) ConvLSTM forecast map;(c) PredRNN forecast map
    Fig. 4. Example of weather forecast from 12:00 to 17:00, September 14, 2020. (a) True value; (b) ConvLSTM forecast map;(c) PredRNN forecast map
    Example of weather forecast from 18:00 to 23:00, September 14, 2020. (a) True value; (b) ConvLSTM forecast map;(c) PredRNN forecast map
    Fig. 5. Example of weather forecast from 18:00 to 23:00, September 14, 2020. (a) True value; (b) ConvLSTM forecast map;(c) PredRNN forecast map
    Sample test indexes were predicted on September 14, 2020. (a) Image evaluation indicators; (b) CSI evaluation indicators
    Fig. 6. Sample test indexes were predicted on September 14, 2020. (a) Image evaluation indicators; (b) CSI evaluation indicators
    模型MSE (↓)SSIM (↑)LPIPS (↓)CSI-1000 m (↑)CSI-4000 m (↑)CSI-10000 m (↑)
    ConvLSTM33.210.4870.3270.2330.4760.569
    PredRNN31.650.5110.2700.2600.5020.587
    Table 1. Average quantitative results of visibility field map data set (6 h)
    模型MSE (↓)SSIM (↑)LPIPS (↓)CSI-1000 m (↑)CSI-4000 m (↑)CSI-10000 m (↑)
    ConvLSTM70.320.3810.3730.1750.4180.511
    PredRNN58.730.4100.3250.1880.4410.541
    Table 2. Average quantitative results of visibility field map data set (12 h)
    Xulun BAO, Yi LI, Yiwen Hu, Yang WANG, Dan NIU, Zengliang ZANG, Xisong CHEN. Atmospheric visibility prediction method based on ConvLSTM and PredRNN[J]. Journal of Atmospheric and Environmental Optics, 2023, 18(5): 434
    Download Citation