
P.-G. Bleotu, J. Wheeler, S. Yu. Mironov, V. Ginzburg, M. Masruri, A. Naziru, R. Secareanu, D. Ursescu, F. Perez, J. De Sousa, D. Badarau, E. Veuillot, P. Audebert, E. Khazanov, G. Mourou. Post-compression of high-energy, sub-picosecond laser pulses[J]. High Power Laser Science and Engineering, 2023, 11(2): 02000e30
- High Power Laser Science and Engineering
- Vol. 11, Issue 2, 02000e30 (2023)
Abstract
1 Introduction
The efficient compression of the available laser energy into an ever shorter pulse duration is an important tool in creating ultra-high-peak intensity laser pulses. Few-cycle, and even single-cycle, laser systems are routinely available at table-top (mJ and below) scale energy levels that have opened up a wide range of applications in strong-field physics, including time-resolved imaging and pump-probe studies. High-power, few-cycle laser pulses at the level of multiple Joules are considered an important next step in the efficient control over strong-field, laser–plasma processes to extend into the next level of practical applications related to particle acceleration and nuclear photonics[1]. While chirped pulse amplification (CPA)[2–4] has enabled the advancement of ever-growing energy levels into short pulse laser systems, the limitations in bandwidth for the amplifiers and stretcher–compressor technology has historically limited high-energy pulses from reaching their shortest possible duration, as defined by the carrier wavelength (
In contrast, the thin film compressor (TFC), or compression after compressor approach (CAfCA), is demonstrated for the post-compression of just such large-scale CPA laser systems[9–11]. The basic principle relies upon current concepts of post-compression where a nonlinear process such as self-phase modulation (SPM) introduces additional spectral bandwidth, and then the phase of the pulse must be controlled over the entire bandwidth to maintain the desired pulse duration. For the TFC, it is sufficient to use a transparent film of appropriate thickness interacting across the full aperture of the freely propagating flat-top, high-energy pulse within its transport from the final optical compressor to the final target. The intensity of these pulses – of the order of TW/cm2 – is sufficient to drive nonlinear spectral broadening through SPM that arises from the time-dependence of the material index of refraction,
The SPM process is the effect of the rapid change in the material index of refraction associated with the fast electric field oscillations of the intense laser pulses. The bandwidth modifications are easier to observe on laser systems with a shorter initial pulse. Thus, the compression technique has been studied at the TW-scale at several of these laser systems, including CETAL, ALLS, PEARL, ELI-NP and CoReLS[13–19], demonstrating up to five-fold pulse compression[20], and even six-fold[21]. The technique was applied in producing betatron radiation from laser wakefield acceleration (LWFA)[22] , and the method is now being implemented on PW-scale laser systems[23,24]. A successful demonstration of the TFC on a laser system with an initial duration greater than 100 fs has great potential as an economical upgrade to existing picosecond-scale, high-energy laser systems, such as PETAL, OMEGA-EP and Vulcan.
Sign up for High Power Laser Science and Engineering TOC. Get the latest issue of High Power Laser Science and Engineering delivered right to you!Sign up now
To date, post-compression has been tested with long pulses at only tens of mJ[25,26] but preliminary numerical simulations for post-compressing PETAL laser parameters of 1 kJ, 0.5 ps and 200 mm diameter beam predict the ability to reach approximately 100 fs and suggest the peak power could be increased by nearly four times with a single-stage compressor[13].
In addition to existing laser installations, there is the possibility to apply the post-compression to novel designs. The need for an efficient high peak and average power laser driver is crucial for laser–plasma processes to be extended beyond discovery science and be put into practical application. A proposed solution for an industrial-scale, high-energy laser operating at more than or equal to 100 kHz employs a fiber chirped pulse amplification (FCPA) system. The small energy of a single fiber amplifier can be overcome by coherently combining several such amplifiers in parallel. This laser architecture concept is also known as the coherent amplification network (CAN). It has been introduced for driving particle acceleration[27,28] and systems with up to 61 fibers are under further development[29,30]. While efficiently producing pulses at a high repetition rate, the bandwidth limitation of a fiber-based amplifier places the minimum pulse duration near 300 fs and would require a post-compressor to reach the few-cycle pulse regime. Therefore, an FCPA laser system will likely benefit from highly efficient post-compression stages in order to reach a high compression factor. The development of an efficient and expandable CAN laser system based on fiber laser technology gives access to an economical and flexible tool capable of meeting the requirements of a wide range of applications, including the ability to drive the multiple stages of acceleration within a laser accelerator facility[31].
The output bandwidth of the SPM process (
An advantage of beginning from long Fourier transform-limited (FL) pulses is the extremely weak influence of the linear dispersion of the medium. As the parameter
The dispersion management requires a high GDD, as the phase correction is proportional to the square of
This is highlighted within this experiment (see Figure 1, ELFIE laser, 350 fs) where the dispersion introduced by the diagnostic beam transport – including a set of CMs (–6000 fs2) – is not significant enough to show effects on the initial pulse, while the spectrally broadened pulse reaches bandwidths that are sensitive to the dispersion. For an existing beamline, any change in the pulse duration will need to consider the limitations of the subsequent optics in effectively transporting the modified pulse. Again, the use of multiple compression stages with each stage designed to accommodate the increasing bandwidth/decreasing FL pulse duration and the corresponding increase in pulse intensity will likely be required in order to reach the highest pulse compression factors.
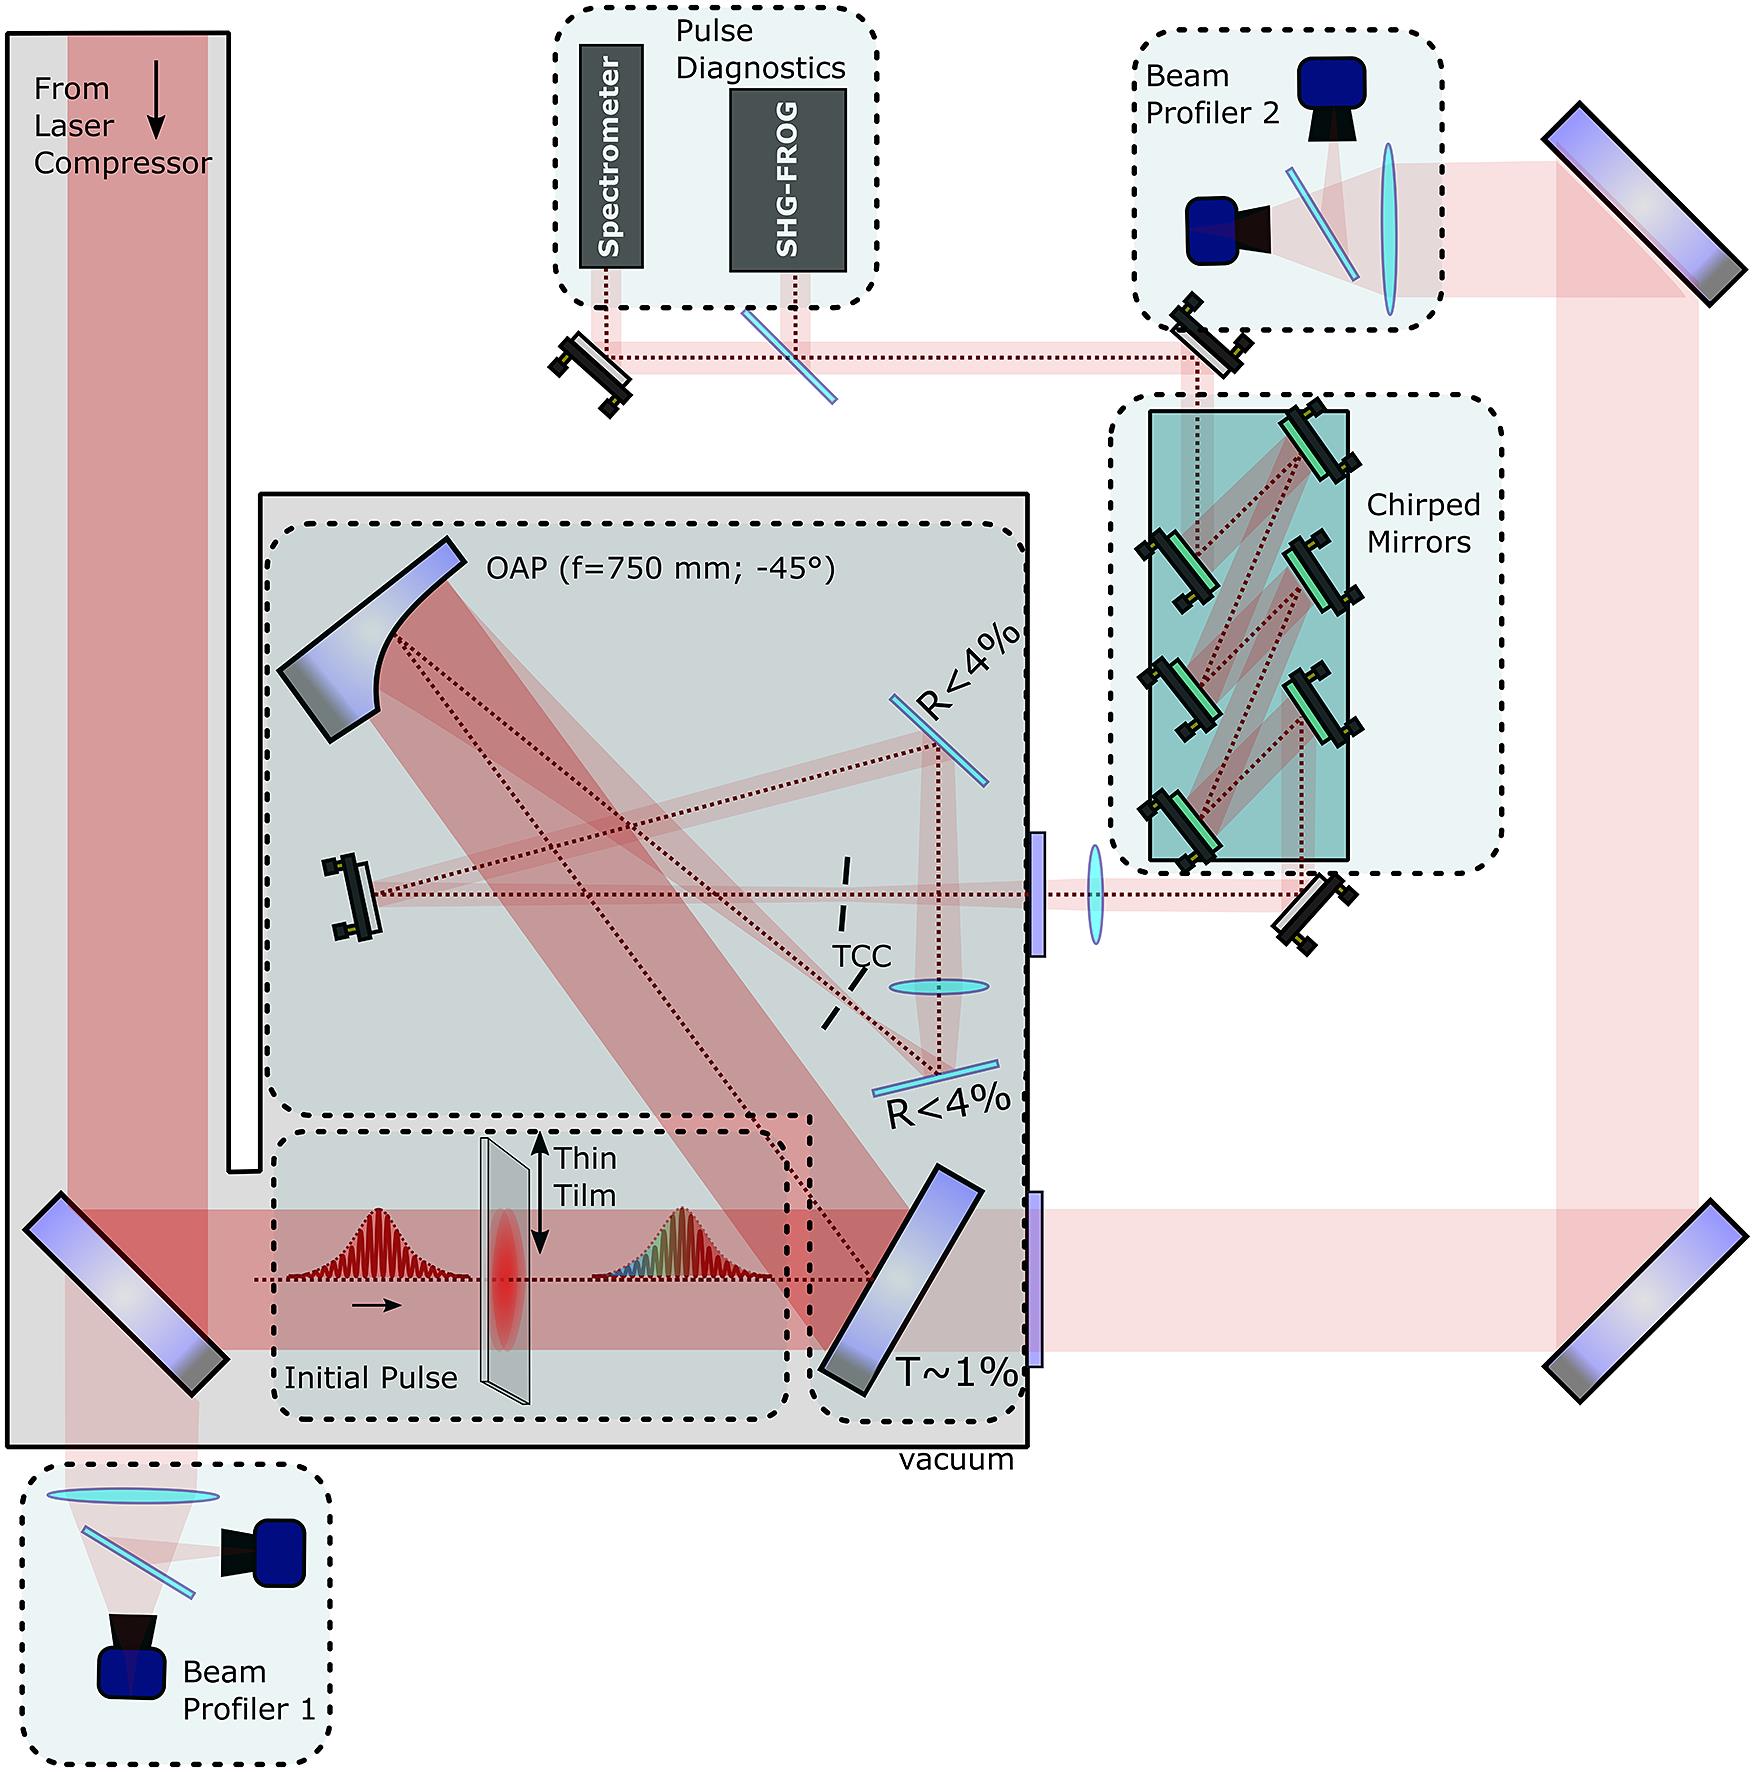
Figure 1.The experimental setup for a demonstration of the post-compressor within the ELFIE interaction chamber. OAP is the off-axis parabolic mirror and TCC is its focus position.
As the peak power of the pulse exceeds the critical power
Therefore, the evolution of the small-scale self-focusing (SSSF) and multi-filamentation process that develops due to modulation instabilities in the beam must be considered in order to understand how it will be detected in measurements of the near-field profile. An important aspect is controlling the influence of the SPM process on the beam profile quality[34–36] and the small-scale filamentation and beam break-up. Unmitigated development within the profile eventually leads to damage of the nonlinear material or subsequent optics and loss of pulse energy, and the aberrations diminish the achievable focus quality.
In this paper, measurements of spectral broadening and the influence of the SPM process for a sub-picosecond high-energy laser pulse interacting with glass and polymer materials are reported. Section 2 describes the experimental configuration implemented during the campaign at the ELFIE laser facility. Section 3 examines three aspects of the laser pulse following the nonlinear interaction: (1) the effect on the laser focus; (2) the measured spectral and the temporal responses are compared with the expectation from simulations; (3) the relative gain in the spatial modulation instabilities of post-compressed laser pulses. Section 4 summarizes the implications of the results in planning future experiments.
2 Methods
2.1 Laser system
The ELFIE laser facility is based on a CPA laser architecture starting from a Ti:sapphire front-end followed by mixed silicate/phosphate glass amplifiers. The laser beam is compressed under vacuum to a duration of roughly 350 fs at wavelength
For this campaign, the laser pulse energy is measured to be
Just as with the shot-to-shot variation of the pulse energy, the duration has been noticed to fluctuate in the temporal measurements but stayed between 330 and 380 fs with the mean value of 350 fs corresponding to a factor of 1.1 times the FL pulse duration after the compressor. Achieving this duration at full power did require adjusting the optical grating separation distance by approximately 1.25 mm relative to the optimum measured under the low-energy alignment conditions. The compressor position is best optimized by observing the nonlinear spectral broadening and maximizing its spread (see Section 3.2). The peak intensity among the shots is estimated to fall between
2.2 Post-compression test configuration
The experimental setup is depicted in Figure 1. A beam profiler (BP1) monitors the leakage passing through the last turning mirror before entering the interaction chamber. The TF (technically an optical window at the thickness required for these intensities) is mounted to a motorized stage installed shortly after the entrance to the interaction vacuum chamber within the ELFIE installation. The mount enables the TF to be inserted or removed without requiring the chamber to be opened.
Two types of materials are considered: FS glass and cyclic-olefin polymer (COP, known as Zeonor). The thickness of the nonlinear plates is 5 mm for FS and 2 mm for COP. Their relevant optical properties are summarized in Table 1. The FS sample is a laser-grade optical window, while the COP sample is an optical slide made for the manufacture of optical chips in microfluidic studies and is not of optical laser quality (i.e., wavefront, roughness). This difference becomes obvious in the results but information on the polymer sample is included to compare the nonlinear response for its potential application within laser-quality optical samples.
| Material | FS | COP |
|---|---|---|
| 5 | 2 | |
| 1.4497 | 1.5201 | |
| 16.994 | 52.217 |
Table 1. Thin film material properties at  nm.
nm.
After the initial laser pulse interaction with the TF element, the objective is to sample the focus, monitor the beam spatial mode quality for film damage and record the pulse spectrum and its duration. Care must be taken in the attenuation of the pulse energy to avoid contributing additional nonlinear effects in the subsequent optical elements. However, at the expected pulse duration (
The reflected fraction of the beam continues to the standard off-axis parabola (OAP) of the interaction chamber, which is employed as the first of a three-element reducing telescope. An uncoated wedge is placed at a sufficient distance, after the target chamber center (TCC) focus of the OAP, to attenuate the beam (reflectance
The low-energy pulse passes through a 7-mm-thick MgF2 window to be re-collimated by a third lens to a beam of approximately 1 cm diameter before continuing to the optical diagnostic table on 25 mm aperture optics.
A series of six negative-dispersion mirrors (UFI HD65; design bandwidth 1010–1070 nm) are installed that can each provide a phase correction of
3 Results
The modified properties of the laser pulse are measured after the interaction with the nonlinear substrate. The three primary aspects reported here are the effect on the focus, the spectral/temporal response and the small-scale features that develop within the beam spatial profile.
3.1 Focus quality of the optical components
The quality of the optical components, including in particular the transmitted wavefront distortion, plays an important role in the far-field (FF) modifications of the laser beam. In Figure 2, a comparison of the focal spots measured in the BP2 profile is presented using the reference beam without material, after 5 mm FS and after 2 mm COP. The low optical quality of the COP material is obvious in the deterioration of the focal spot in Figure 2, right-hand side.
![]()
Figure 2.Images of the focused laser beam after traversing no material (left), 5 mm fused silica glass (center) and 2 mm COP (right).
A suitable implementation of this material with mm-scale thickness will require higher laser quality samples to be used. The beam can still be brought to a focal spot comparable to the original reference if a better laser quality substrate, such as an FS sample (despite being thicker), is used. Even if the FF image is degraded, a deformable mirror is likely capable of compensating for the wavefront deformation, as shown in Ref. [39]. Due to the low optical quality of this sample of COP, the wavefront is too disrupted for correction or pulse characterization, beyond simple spectrometer measurements.
3.2 Spectral response
The effects of the COP on the beam adversely impact the pulse duration measurements of the resultant pulse, and so only the spectrum produced by COP is given for comparison with FS. Results of simulations of the spectrum broadening and temporal post-compression for the ELFIE laser pulse interacting with 5 mm FS are shown in Figure 3. The temporal shape of the laser pulse is obtained with the help of the inverse Fourier transform from the measured spectral intensity distribution (see Figures 3(e) and 3(f)). The initial condition assumes that the pulse on the entrance surface has the FL duration of Tin = 300 fs and a flat-top beam diameter of 9 cm. Taking into account that the pulse energy can vary from shot to shot, a range of energies up to 10 J is considered in the calculations.
![]()
Figure 3.Simulations of spectral broadening for pulses interacting with 5 mm fused silica, based on ELFIE laser parameters. The top row (a)–(c) considers the resultant spectra and pulse temporal shape for the compressed pulse as a function of the input pulse energy. Middle column: pulse shape for the dispersion compensation  = –6000 fs
 . Right-hand column: FL pulse shapes. In (d), the dotted red and blue lines describe the duration of the FL compressed pulse (red solid) and fixed
  fs2 (blue solid), respectively. (e) The measured input spectrum (blue) and output spectrum (dotted red) for 4.8 J pulse energy. (f) The corresponding reconstructed shape for input (300 fs, blue) and output (170 fs, dotted red) pulse.
Figure 3(a) describes the simulated spectral broadening as a function of the energy after the pulse travels through the FS plate. In accordance with this figure, more energy in the initial pulse corresponds to higher nonlinear phase accumulation and, as a consequence, wider spectral broadening. The temporal intensity distributions of the compressed laser pulse obtained after spectral phase correction with the CM having the GDD parameter
![]()
Figure 4.The spectral broadening occurring due to self-phase modulation (SPM) with no material (red line), fused silica (green line) and COP (orange line) is compared with the laser spectrum measured before the interaction (blue dashed) in (a)–(c). The initial pulse spectrum measured with no material presented in (a) shows no significant change in the spectra. In (b), a 4.8 J pulse interacts with 5 mm of fused silica, and (c) shows the result of a 3.9 J pulse passing through 2 mm of COP. The autocorrelator measurements shown in (d) and (e) give the FWHM fit in the case of no material (0.50 ± 0.05 ps) and fused silica (0.41 ± 0.9 ps), which correspond to pulse durations for the specific cases shown of 0.34 and 0.2 ps, respectively. In (f), the resulting spectral FWHM bandwidth in nm is measured relative to the input pulse chirp, as defined by the variation of the laser compressor grating separation ( [mm]). The initial FWHM bandwidth measured with no material (red vertical line) remains fairly constant at 5.1 nm despite the change in the separation of the laser compressor gratings. With the FS, the compressor position becomes optimized when the broadened bandwidth (green dot) is maximized relative to the measured laser bandwidth (blue circle).
The spectral amplitudes recorded during the experimental campaign by the imaging spectrometer are shown in Figure 4. The original laser spectrum sampled after the final amplifier (blue dashed line) is compared with the broadening that occurs when no material (Figure 4(a), red line), FS (Figure 4(b), green line) and COP (Figure 4(c), orange line) are present in the beam during the same shot. Throughout Figure 4, the central wavelength of the laser system is
For the laser shot interacting with the COP film in Figure 4(c), the pulse energy is lower at
From this data, the measured ratio for the spectral increase for FS is
Figures 4(d) and 4(e) show the AC measurement with no material and after the interaction with the FS window along with the set of CMs. Assuming a Gaussian pulse temporal profile, the AC fit gives an initial reference pulse duration of 340 fs and a reduced pulse duration of 200 fs after the introduction of the FS. This suggests a chirp due to GDD of approximately
In Figure 4(f), the dependence of the spectral FWHM bandwidth with FS is compared with no material as a function of the chirp of the input pulse by varying the separation of the gratings in the laser compressor.
With the FS installed, the optimized compressor position was retrieved when the bandwidth was maximized at 13.3 nm and then decreased as the grating separation moved in either direction.
3.3 Beam spatial profile
In Figure 5, full aperture images of the beam from the BP2 diagnostics, before (Figure 5(a)) and after (Figure 5(b)) the material insertion, illustrate the evolution of the spatial modulation. Two circular regions are selected for the spatial frequency analysis of the modulations in the beam. The region labeled I in Figure 5(a) corresponds to high average fluence, while the region labeled II has 1.7 times less, corresponding to the reduced B-integral.
![]()
Figure 5.Beam profile comparison between the reference (a) and FS (b); in (c) the power spectrum of two separate laser regions (regions I and II, denoted by black and green, respectively), before and after the nonlinear interaction. The ratio of the power spectra, relative to the initial corresponding reference, gives the relative gain in the spatial modulation instabilities (SMIs) in (d).
In Figure 5(c), the angular integration of the 2D fast Fourier transform (FFT) of the two beam profile regions before and after the introduction of the materials quantifies the small-scale spatial features that develop within the beam profile due to the SPM.
The near-field system is capable of resolving images with the smallest feature of the beam of approximately 0.59 mm (q
Figure 5(d) depicts the ratio of the power spectra before and after the introduction of the nonlinear material, for each of the two regions. Several features are observed: the relative gain at high frequencies of approximately 4 stays flat in the spatial modulation instabilities over the accessible frequencies for both curves, even though there is a 1.7 factor difference in the B-integral.
However, at low spatial frequencies the behavior is different. The low-intensity region II has reduced the gain of the modulations below 0.3 mm−1, while the high-intensity region indicates gain in the modulation for the region 0.1–0.3 mm−1.
This is the signature of the presence of two types of self-focusing: large-scale and SSSF. Large-scale self-focusing is determined by Pcr and if the length of the medium is close to the length of self-focusing, one can observe it.
The growth amplitude of the spatial harmonics starts to be observable when the B-integral becomes larger than unity and its frequencies belong to an amplification band. The boundary of the band depends on the beam intensity and cubic nonlinearity coefficient n2, and does not depend on the length of the nonlinear plate (see, for example, Ref. [40]).
A similar behavior of the spatial noise amplification was observed in Ref. [41] (Figure 4, where L = 200 mm has similar pattern to our beam profile), where the gain factor of spatial noise depends on the spatial frequency and B-integral. A simple theoretical model, which describes a monochromatic plane wave instability in media with cubic nonlinearity, has been demonstrated (see Ref. [40] and references therein). This model indicates that the position of maxima and dips, in the dependence of the spatial noise amplification gain factor versus spatial frequency, is determined by a B-integral value and the distance between the spatial noise source and the nonlinear sample. In real laser setups, sources of spatial noises are distributed along the beam path and the behavior of the gain factor versus spatial frequencies, which can be observed in experiments, is not well described by the model and requires additional studies. Moreover, there are at least two factors that need to be taken into account in the theoretical model: spatial[42,43] and temporal filtering of spatial harmonics from an area of strong field inside a nonlinear sample. Both lead to an additional suppression of SSSF developments.
Analysis of an amplification of spatial harmonic amplitudes is useful in order to estimate the amount of B-integral and to limit the amplification of SSSF at the value when it becomes detrimental to the quality of the beam.
4 Conclusion
A proof-of-principle demonstration was presented of the post-compression for long pulses (
The experimental and theoretical predictions retrieved from Ref. [41] are qualitatively and quantitatively reproduced by the results obtained at ELFIE. Hence, the experiment at ELFIE complements and partly confirms the theoretical predictions.
Despite the shot-to-shot fluctuations coupled with the low repetition rate of the laser system, which made the optimization of the pulse duration signal difficult, the post-compression method proves simple to implement within a laser system and under consistent conditions should remain robust. The development of large-aperture negative-dispersive mirrors will make the inclusion of such a post-compressor possible for full energy delivery to the target. For an existing facility, the need to effectively transport the modified pulse requires considering the bandwidth limitations in the coatings or additional contribution to the dispersion due to the subsequent optics in the beamline. However, the compactness of the TFC offers flexibility of its placement within the beam transport.
References
[1] J. A. Wheeler, G. Mourou, T. Tajima. Rev. Accel. Sci. Technol., 10, 227(2019).
[2] D. Strickland, G. Mourou. Opt. Commun., 56, 219(1985).
[3] D. Strickland. Rev. Mod. Phys., 91, 030502(2019).
[4] G. Mourou. Rev. Mod. Phys., 91, 030501(2019).
[5] C. Markos, J. C. Travers, A. Abdolvand, B. J. Eggleton, O. Bang. Rev. Mod. Phys., 89, 045003(2017).
[6] T. Nagy, P. Simon, L. Veisz. Adv. Phys., 6, 1845795(2020).
[7] M. Hanna, F. Guichard, N. Daher, Q. Bournet, X. Delen, P. Georges. Laser Photonics Rev., 15, 2100220(2021).
[8] E. A. Khazanov. Quantum Electron., 52, 208(2022).
[9] V. Chvykov, C. Radier, G. Chériaux, G. Kalinchenko, V. Yanovsky, G. Mourou. Conference on Lasers and Electro-Optics 2010(2010).
[10] G. Mourou, S. Mironov, E. Khazanov, A. Sergeev. Eur. Phys. J. Spec. Top., 223, 1181(2014).
[11] E. A. Khazanov, S. Y. Mironov, G. Mourou. Uspekhi Fizicheskih Nauk, 189, 1173(2019).
[12] V. N. Ginzburg, I. V Yakovlev, A. S. Zuev, A. P. Korobeynikova, A. A. Kochetkov, A. A. Kuzmin, S. Y. Mironov, A. A. Shaykin, I. A. Shaikin, E. A. Khazanov. Quantum Electron., 50, 331(2020).
[13] S. Y. Mironov, J. Wheeler, R. Gonin, G. Cojocaru, R. Ungureanu, R. Banici, M. Serbanescu, R. Dabu, G. Mourou, E. A. Khazanov. Quantum Electron., 47, 173(2017).
[14] S. Y. Mironov, V. N. Ginzburg, I. V Yakovlev, A. A. Kochetkov, A. A. Shaykin, E. A. Khazanov, G. A. Mourou. Quantum Electron., 47, 614(2017).
[15] V. N. Ginzburg, I. V Yakovlev, A. S. Zuev, A. P. Korobeynikova, A. A. Kochetkov, A. A. Kuz’min, S. Y. Mironov, A. A. Shaykin, I. A. Shaykin, E. A. Khazanov. Quantum Electron., 49, 299(2019).
[16] D. M. Farinella, M. Stanfield, N. Beier, T. Nguyen, S. Hakimi, T. Tajima, F. Dollar, J. Wheeler, G. Mourou. Int. J. Mod. Phys. A, 34, 1943015(2019).
[17] D. Ursescu, D. Matei, M. Talposi, V. Iancu, V. Aleksandrov, G. Bleotu, A. Naziru, O. Tesileanu, M. Rosu, Y. Nakamiya, M. Cernaianu, B. de Boisdeffre, C. Ene, M. Caragea, A. Lazar, M. Kiss, M. Masruri, L. Caratas, A. Toader, D. Nistor, V. Luta, B. Tatulea, D. Popa, N. Stan, T. Jitsuno, R. Banici, A. Baleanu, A. Gradinariu, J. Wheeler, G. Mourou, I. Dancus. Frontiers in Optics and Laser Science(2020).
[18] S. Y. Mironov, S. Fourmaux, P. Lassonde, V. N. Ginzburg, S. Payeur, J.-C. Kieffer, E. A. Khazanov, G. Mourou. Appl. Phys. Lett., 116, 241101(2020).
[19] J. I. Kim, Y. G. Kim, J. M. Yang, J. W. Yoon, J. H. Sung, S. K. Lee, C. H. Nam. Opt. Express, 30, 8734(2022).
[20] V. Ginzburg, I. Yakovlev, A. Zuev, A. Korobeynikova, A. Kochetkov, A. Kuzmin, S. Mironov, A. Shaykin, I. Shaikin, E. Khazanov, G. Mourou. Phys. Rev. A, 101, 013829(2020).
[21] A. Shaykin, V. Ginzburg, I. Yakovlev, A. Kochetkov, A. Kuzmin, S. Mironov, I. Shaikin, S. Stukachev, V. Lozhkarev, A. Prokhorov, E. Khazanov. High Power Laser Sci. Eng., 9, e54(2021).
[22] S. Fourmaux, P. Lassonde, S. Y. Mironov, E. Hallin, F. Légaré, S. Maclean, E. A. Khazanov, G. Mourou, J. C. Kieffer. Opt. Lett., 47, 3163(2022).
[23] V. Ginzburg, I. Yakovlev, A. Kochetkov, A. Kuzmin, S. Mironov, I. Shaikin, A. Shaykin, E. Khazanov. Opt. Express, 29, 28297(2021).
[24] P.-G. Bleotu, J. Wheeler, D. Papadopoulos, M. Chabanis, J. Prudent, M. Frotin, L. Martin, N. Lebas, A. Freneaux, A. Beluze, F. Mathieu, P. Audebert, D. Ursescu, J. Fuchs, G. Mourou. High Power Laser Sci. Eng., 10, e9(2022).
[25] G. Fan, P. A. Carpeggiani, Z. Tao, G. Coccia, R. Safaei, E. Kaksis, A. Pugzlys, F. Légaré, B. E. Schmidt, A. Baltuška. Opt. Lett., 46, 896(2021).
[26] J. Schulte, T. Sartorius, J. Weitenberg, A. Vernaleken, P. Russbueldt. Opt. Lett., 41, 4511(2016).
[27] G. Mourou, B. Brocklesby, T. Tajima, J. Limpert. Nat. Photonics, 7, 258(2013).
[28] J. Wheeler, G. Mourou, T. Tajima. Rev. Accel. Sci. Technol., 9, 151(2016).
[29] R. Soulard, M. N. Quinn, G. Mourou. Appl. Opt., 54, 4640(2015).
[30] I. Fsaifes, L. Daniault, S. Bellanger, M. Veinhard, J. Bourderionnet, C. Larat, E. Lallier, E. Durand, A. Brignon, J.-C. Chanteloup. Opt. Express, 28, 20152(2020).
[31] K. Nakajima, J. Wheeler, G. Mourou, T. Tajima. Int. J. Mod. Phys. A, 34, 1943003(2019).
[32] V. I. Bespalov, V. I. Talanov. ZhETF Pisma, 3, 471(1966).
[33] A. M. Rubenchik, S. K. Turitsyn, M. P. Fedoruk. Opt. Express, 18, 1380(2010).
[34] A. A. Voronin, A. M. Zheltikov. Phys. Rev. A, 94, 023824(2016).
[35] A. A. Voronin, A. M. Zheltikov, T. Ditmire, B. Rus, G. Korn. Opt. Commun., 291, 299(2013).
[36] D. M. Farinella, J. Wheeler, A. E. Hussein, J. Nees, M. Stanfield, N. Beier, Y. Ma, G. Cojocaru, R. Ungureanu, M. Pittman, J. Demailly, E. Baynard, R. Fabbri, M. Masruri, R. Secareanu, A. Naziru, R. Dabu, A. Maksimchuk, K. Krushelnick, D. Ros, G. Mourou, T. Tajima, F. Dollar. J. Opt. Soc. Am.(2019).
[37] A. J. Taylor, T. S. Clement, G. Rodriguez. Opt. Lett., 21, 1812(1996).
[38] J. Wheeler, G. P. Bleotu, A. Naziru, R. Fabbri, M. Masruri, R. Secareanu, D. M. Farinella, G. Cojocaru, R. Ungureanu, E. Baynard, J. Demailly, M. Pittman, R. Dabu, I. Dancus, D. Ursescu, D. Ros, T. Tajima, G. Mourou. Photonics, 9, 715(2022).
[39] J. I. Kim, J. I. Kim, J. W. Yoon, J. W. Yoon, J. M. Yang, Y. G. Kim, J. H. Sung, J. H. Sung, S. K. Lee, S. K. Lee, S. K. Lee, C. H. Nam, C. H. Nam, C. H. Nam. Opt. Express, 30, 26212(2022).
[40] A. K. Potemkin, E. A. Khazanov, M. A. Martyanov, M. S. Kochetkova. IEEE J. Quantum Electron., 45, 336(2009).
[41] V. N. Ginzburg, A. A. Kochetkov, A. K. Potemkin, E. A. Khazanov. Quantum Electron., 48, 325(2018).
[42] S. Y. Mironov, V. V. Lozhkarev, V. N. Ginzburg, I. V. Yakovlev, G. Luchinin, A. Shaykin, E. A. Khazanov, A. Babin, E. Novikov, S. Fadeev, A. M. Sergeev, G. A. Mourou. IEEE J. Select. Top. Quantum Electron., 18, 7(2012).
[43] S. Mironov, V. Lozhkarev, G. Luchinin, A. Shaykin, E. Khazanov. Appl. Phys. B, 113, 147(2013).

Set citation alerts for the article
Please enter your email address
© Copyright 2018-2021 | Chinese Laser Press. All Rights Reserved 沪ICP备15018463号-20