• Acta Photonica Sinica
  • Vol. 51, Issue 4, 0404001 (2022)
Yang LI1、2, Donggen LUO1、*, Liang SUN1, Shuang LI1, Pingping YAO1, Guangfeng XIANG1、2, Lulu FANG1、3, and Jin HONG1
Author Affiliations
  • 1Anhui Institute of Optics and Fine Mechanics,Hefei Institutes of Physical Science,Chinese Academy of Sciences,Hefei 230031,China
  • 2University of Science and Technology of China,Hefei 230026,China
  • 3Anhui University,Hefei 230601,China
  • show less
    DOI: 10.3788/gzxb20225104.0404001 Cite this Article
    Yang LI, Donggen LUO, Liang SUN, Shuang LI, Pingping YAO, Guangfeng XIANG, Lulu FANG, Jin HONG. Evaluation Criteria and Correction Method of Frame Transfer CCD Camera Smearing[J]. Acta Photonica Sinica, 2022, 51(4): 0404001 Copy Citation Text show less
    The smear in the image taken by DPC
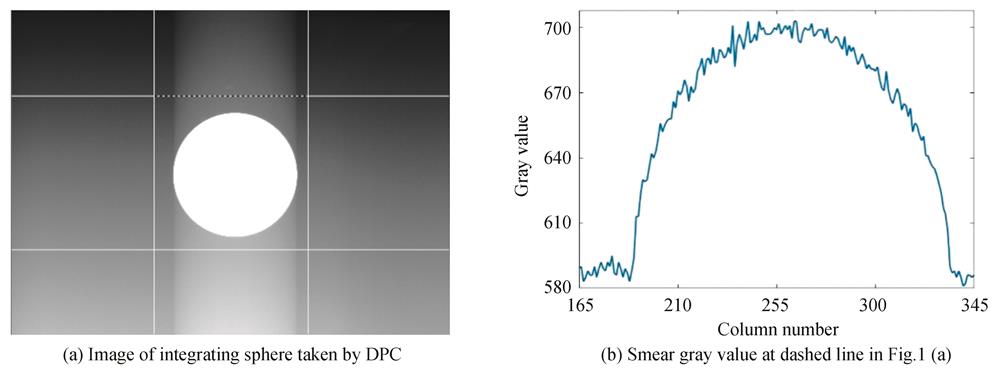
    Fig. 1. The smear in the image taken by DPC
    The diagram of charge removal
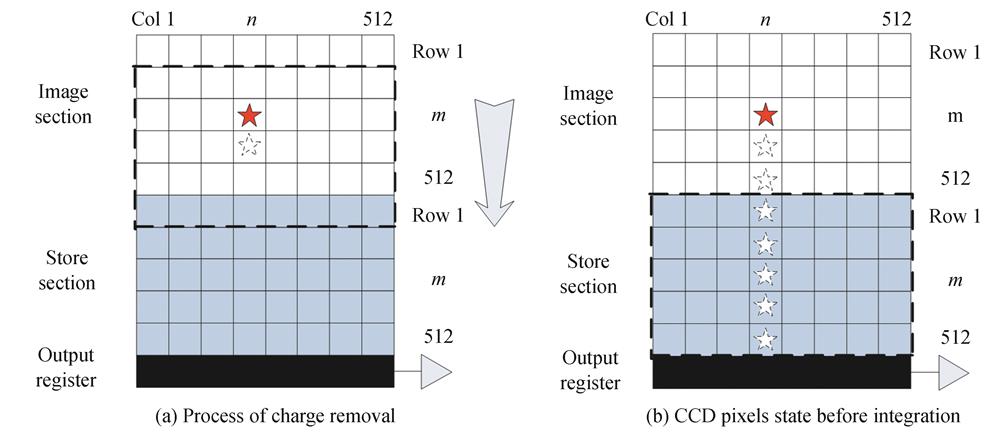
    Fig. 2. The diagram of charge removal
    Frame transfer diagram
    Fig. 3. Frame transfer diagram
    Integrating sphere imaging at the edge of the DPC field of view
    Fig. 4. Integrating sphere imaging at the edge of the DPC field of view
    Gray value of dark line pixels at the edge of the field of view
    Fig. 5. Gray value of dark line pixels at the edge of the field of view
    The simulation model of integrating sphere imaging on frame transfer CCD
    Fig. 6. The simulation model of integrating sphere imaging on frame transfer CCD
    Smear simulation model of integrating sphere in DPC imaging
    Fig. 7. Smear simulation model of integrating sphere in DPC imaging
    Schematic diagram of spot area,smear area and adjacent no smear area in integrating sphere smear simulation image
    Fig. 8. Schematic diagram of spot area,smear area and adjacent no smear area in integrating sphere smear simulation image
    The relationship between the gray value of the spot area pixel and the σsmear in integrating sphere smear simulation image
    Fig. 9. The relationship between the gray value of the spot area pixel and the σsmear in integrating sphere smear simulation image
    The relationship between the gray value of the spot area pixel and the Gsmear in integrating sphere smear simulation image
    Fig. 10. The relationship between the gray value of the spot area pixel and the Gsmear in integrating sphere smear simulation image
    The diagram of DPC imaging system and experimental platform
    Fig. 11. The diagram of DPC imaging system and experimental platform
    The DPC imaging with different number of integrating sphere lights
    Fig. 12. The DPC imaging with different number of integrating sphere lights
    Comparison of evaluation results between experiment and simulation
    Fig. 13. Comparison of evaluation results between experiment and simulation
    The smear percentage of gray standard deviation and average gradient with different target radiance
    Fig. 14. The smear percentage of gray standard deviation and average gradient with different target radiance
    Optimizing algorithm for correcting smear based on the dark lines method
    Fig. 15. Optimizing algorithm for correcting smear based on the dark lines method
    The image and smear formed by the integrating sphere on the 565 nm band of DPC
    Fig. 16. The image and smear formed by the integrating sphere on the 565 nm band of DPC
    The relationship between the number of dark lines and the degree of image smear after correction
    Fig. 17. The relationship between the number of dark lines and the degree of image smear after correction
    The image after correction
    Fig. 18. The image after correction
    The σsmear of each channel after different number of dark lines correction
    Fig. 19. The σsmear of each channel after different number of dark lines correction
    The Gsmear of each channel after different number of dark lines correction
    Fig. 20. The Gsmear of each channel after different number of dark lines correction
    ParameterValue
    Gray value in spot area7201 4402 1592 871
    Maximum gray value in smear area285583111
    Gray value in no smear area0000
    Table 1. The gray value of different regions in integrating sphere smear simulation image
    Number of lights1234681624324864
    Average gray value of spot area1362583885137721 0232 0503 0984 1405 7047 785
    The maximum gray value of smear18202330364286117156220296
    Table 2. The number of lights on the integrating sphere and the gray value of the spot area
    Channel/nm443490(P2)565670(P2)763765865(P2)910
    Optimal dark lines(N910121414141214
    ησ before correction35.64%67.39%32.59%58.15%80.84%76.80%79.68%88.14%
    ησ after correction17.69%27.51%3.31%7.55%11.25%10.47%11.62%16.84%
    ηG before correction14.67%19.64%21.41%34.22%69.60%63.47%66.97%78.82%
    ηG after correction4.19%6.84%5.55%8.79%21.18%17.56%20.43%26.70%
    Table 3. The smear of ησ and ηG before and after correction with optimal dark lines
    Yang LI, Donggen LUO, Liang SUN, Shuang LI, Pingping YAO, Guangfeng XIANG, Lulu FANG, Jin HONG. Evaluation Criteria and Correction Method of Frame Transfer CCD Camera Smearing[J]. Acta Photonica Sinica, 2022, 51(4): 0404001
    Download Citation