• Journal of Geo-information Science
  • Vol. 22, Issue 3, 531 (2020)
Jingdu ZHANG1、1, Zhixiong MEI1、1、2、2、*, Jiahui LV1、1, and Jinzhao CHEN1、1
Author Affiliations
  • 1School of Geography, South China Normal University, Guangzhou 510631, China
  • 1华南师范大学地理科学学院, 广州 510631
  • 2Center for Sustainable Development of Rural and Town in Guangdong-Hong Kong-Marco Greater Bay Area, South China Normal University, Guangzhou 510631, China
  • 2华南师范大学粤港澳村镇可持续发展研究中心, 广州 510631
  • show less
    DOI: 10.12082/dqxxkx.2020.190359 Cite this Article
    Jingdu ZHANG, Zhixiong MEI, Jiahui LV, Jinzhao CHEN. Simulating Multiple Land Use Scenarios based on the FLUS Model Considering Spatial Autocorrelation[J]. Journal of Geo-information Science, 2020, 22(3): 531 Copy Citation Text show less
    Map of the Pearl River Delta region
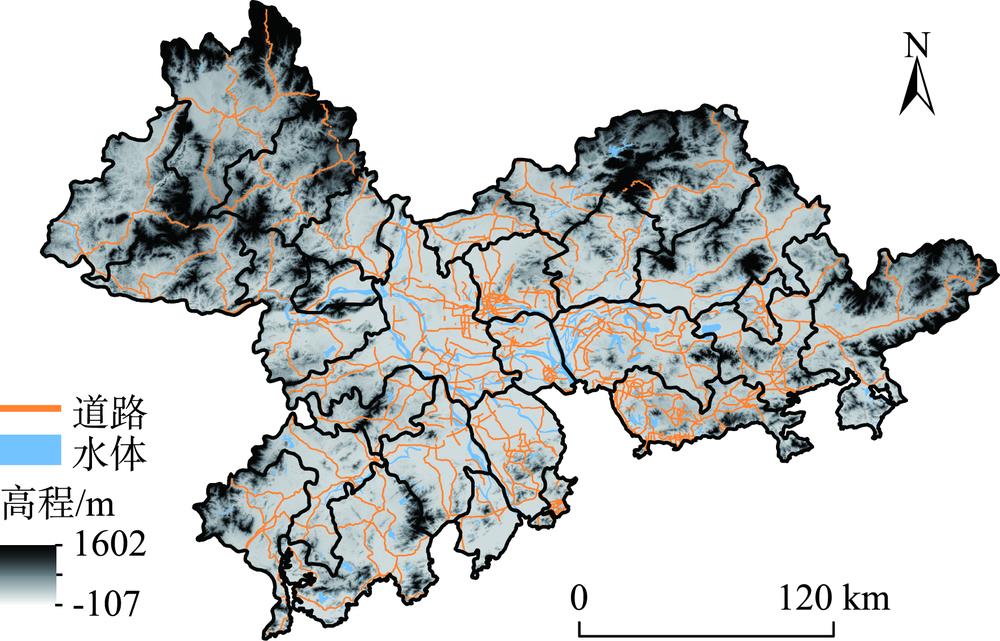
    Fig. 1. Map of the Pearl River Delta region
    Schematic framework of the FLUS model
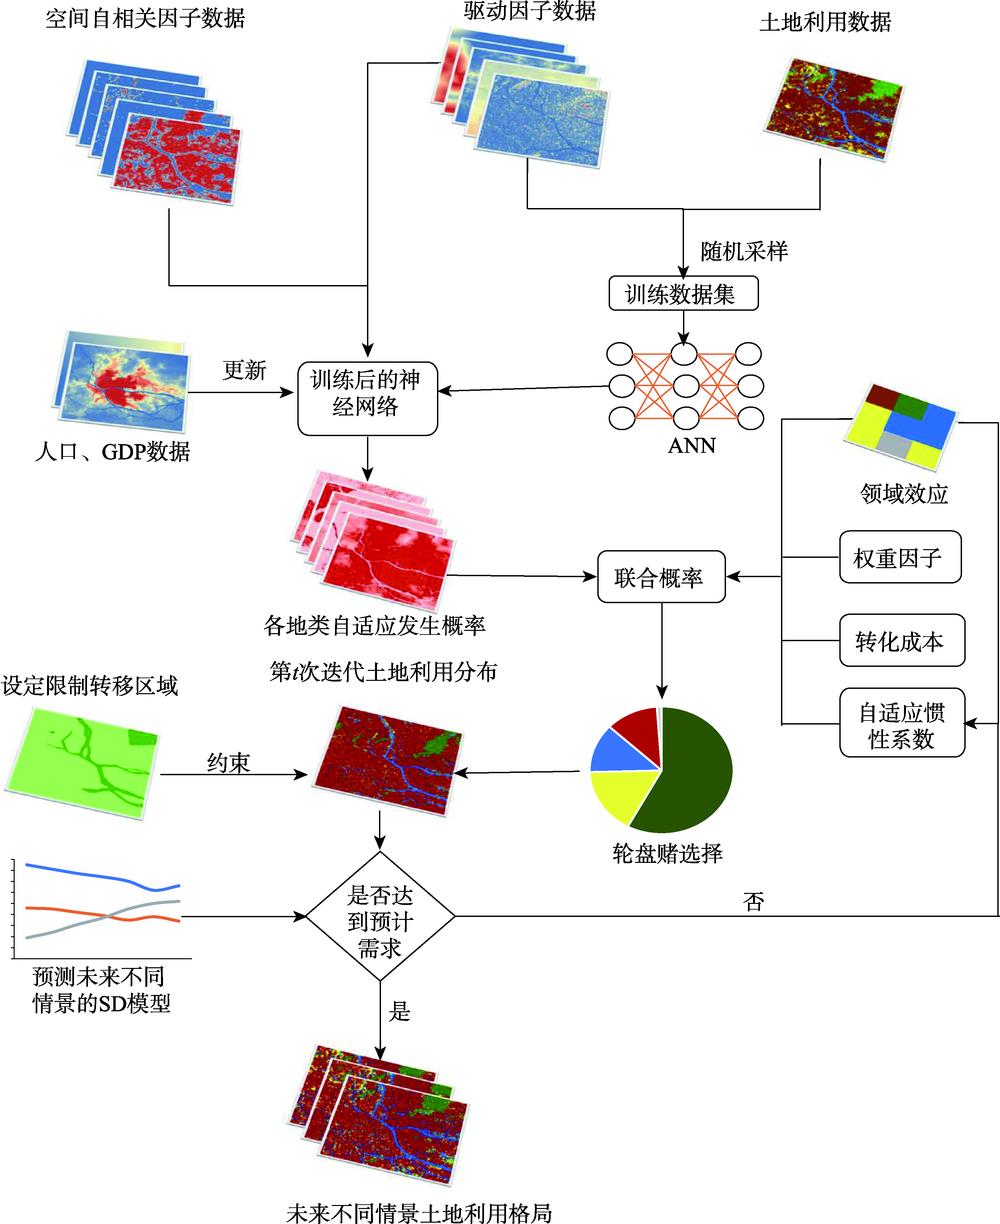
    Fig. 2. Schematic framework of the FLUS model
    The internal structure of system dynamics model for quantity prediction of land use types
    Fig. 3. The internal structure of system dynamics model for quantity prediction of land use types
    Spatial autocorrelation factors for each landuse type after introduced FLUS model
    Fig. 4. Spatial autocorrelation factors for each landuse type after introduced FLUS model
    Comparisons of simulated and actual land use of 2015 in the Pearl River Delta
    Fig. 5. Comparisons of simulated and actual land use of 2015 in the Pearl River Delta
    Spatial distribution of each land use type under the three scenarios of the Pearl River Delta from 2015 to 2035
    Fig. 6. Spatial distribution of each land use type under the three scenarios of the Pearl River Delta from 2015 to 2035
    数据类别数据数据获取年份数据来源
    土地利用数据土地利用数据2009、2015GoogleEarthEngine平台(https://earthengine.google.com/)
    基础地理数据河流、公路、铁路、机场、火车站、城市位置2018OpenStreetMap网站(https://www.openstreetmap.org/)
    自然环境数据DEM2009地理空间数据云平台(http://www.gscloud.cn/)[22]
    土壤含氧量、土壤含氮量、土壤盐碱化程度、土壤功效2008联合国粮农组织官网(http://www.iiasa.ac.at/)[23]
    年均降水、年均气温、各季度平均气温1970—2000年平均值世界气候数据中心(http://www.worldclim.org/)[23]
    社会经济数据人口分布情况2010、2015全球人口网站(https://www.worldpop.org/)[23]
    人口出生率、人口死亡率2009—2015《广东省统计年鉴》[27]
    GDP2009—2015《广东省统计年鉴》[27]
    固定资产投资2009—2015《广东省统计年鉴》[27]
    城镇人口占常住人口比例(城镇化率)2009—2015《广东省统计年鉴》[27]
    粮食总产量2009—2015《广东省统计年鉴》[27]
    Table 1. List of data used in this study
    耕地林地建设用地水体未利用土地
    耕地11110
    林地11001
    建设用地00100
    水体10111
    未利用土地10101
    Table 2. Conversion cost coefficients between land use types
    步长/m
    50100150200250300350400450500
    耕地0.8260.8190.7650.7560.6940.6700.6750.6720.6330.731
    林地0.9180.9280.9170.9030.8910.9070.9010.9110.9190.899
    建设用地0.8860.8850.8670.8290.8050.8240.8570.7630.7590.785
    水体0.8540.8550.8220.8210.7960.7710.7640.7730.6980.750
    未利用土地0.8390.8610.8030.8150.8320.8530.8530.8470.8400.810
    Table 3. The ROC values of the occurrence probabilityof each land use type calculated by ANN at different spatial scales
    Moore邻域
    3×35×57×79×911×1113×1315×1517×1719×19
    Kappa值0.7350.7310.7440.7400.7410.7430.7420.7360.732
    FOM值0.0980.0920.1060.1030.1040.1030.1060.1060.104
    Table 4. Simulation accuracies of FLUS model under different window ranges
    模型kappa系数FOM耕地林地建设用地水体未利用土地
    原始FLUS模型0.7320.077生产者精度0.6720.9320.7330.7840.011
    用户精度0.6700.9290.7320.7890.048
    改进后的FLUS模型0.7440.106生产者精度0.6870.9370.7400.7840.057
    用户精度0.6830.9380.7410.7800.161
    Table 5. Simulation accuracies of the original and improved FLUS models
    Jingdu ZHANG, Zhixiong MEI, Jiahui LV, Jinzhao CHEN. Simulating Multiple Land Use Scenarios based on the FLUS Model Considering Spatial Autocorrelation[J]. Journal of Geo-information Science, 2020, 22(3): 531
    Download Citation