• Acta Photonica Sinica
  • Vol. 49, Issue 12, 93 (2020)
Xu LIU1、2、5, Peng-shuai SUN1、3, Xi YANG1、2, Tao PANG1、3, Hua XIA1、3, Bian WU1、3, Zhi-rong ZHANG1、2、3、4, Zhi-feng SHU6, and Chi-min SHU7
Author Affiliations
  • 1Anhui Provincial Key Laboratory of Photonic Devices and Material, Anhui Institute of Optics and Fine Mechanics, Hefei Institutes of Physical Science, Chinese Academy of Science, Hefei23003, China
  • 2University of Science and Technology of China, Hefei3006, China
  • 3Key Lab of Environmental Optics & Technology, Anhui Institute of Optics and Fine Mechanics, Chinese Academy of Sciences, Hefei2001, China
  • 4Advanced Laserer Tenonology Laboratory of Anhui Province, Heifei230037, China
  • 5School of Electronic and Electrical Engineering, Bengbu University, Bengbu,Anhui233030, China
  • 6School of Physics and Materials Engineering, Heifei Normal University, Heifei23001, China
  • 7Department of Safety Health and Environmental Engineering, Yunlin University of Science and Technology, Yunlin,Taiwan64002, China
  • show less
    DOI: 10.3788/gzxb20204912.1230002 Cite this Article
    Xu LIU, Peng-shuai SUN, Xi YANG, Tao PANG, Hua XIA, Bian WU, Zhi-rong ZHANG, Zhi-feng SHU, Chi-min SHU. High Precision Temperature Control Design for TDLAS Gas Detection System[J]. Acta Photonica Sinica, 2020, 49(12): 93 Copy Citation Text show less
    System design scheme
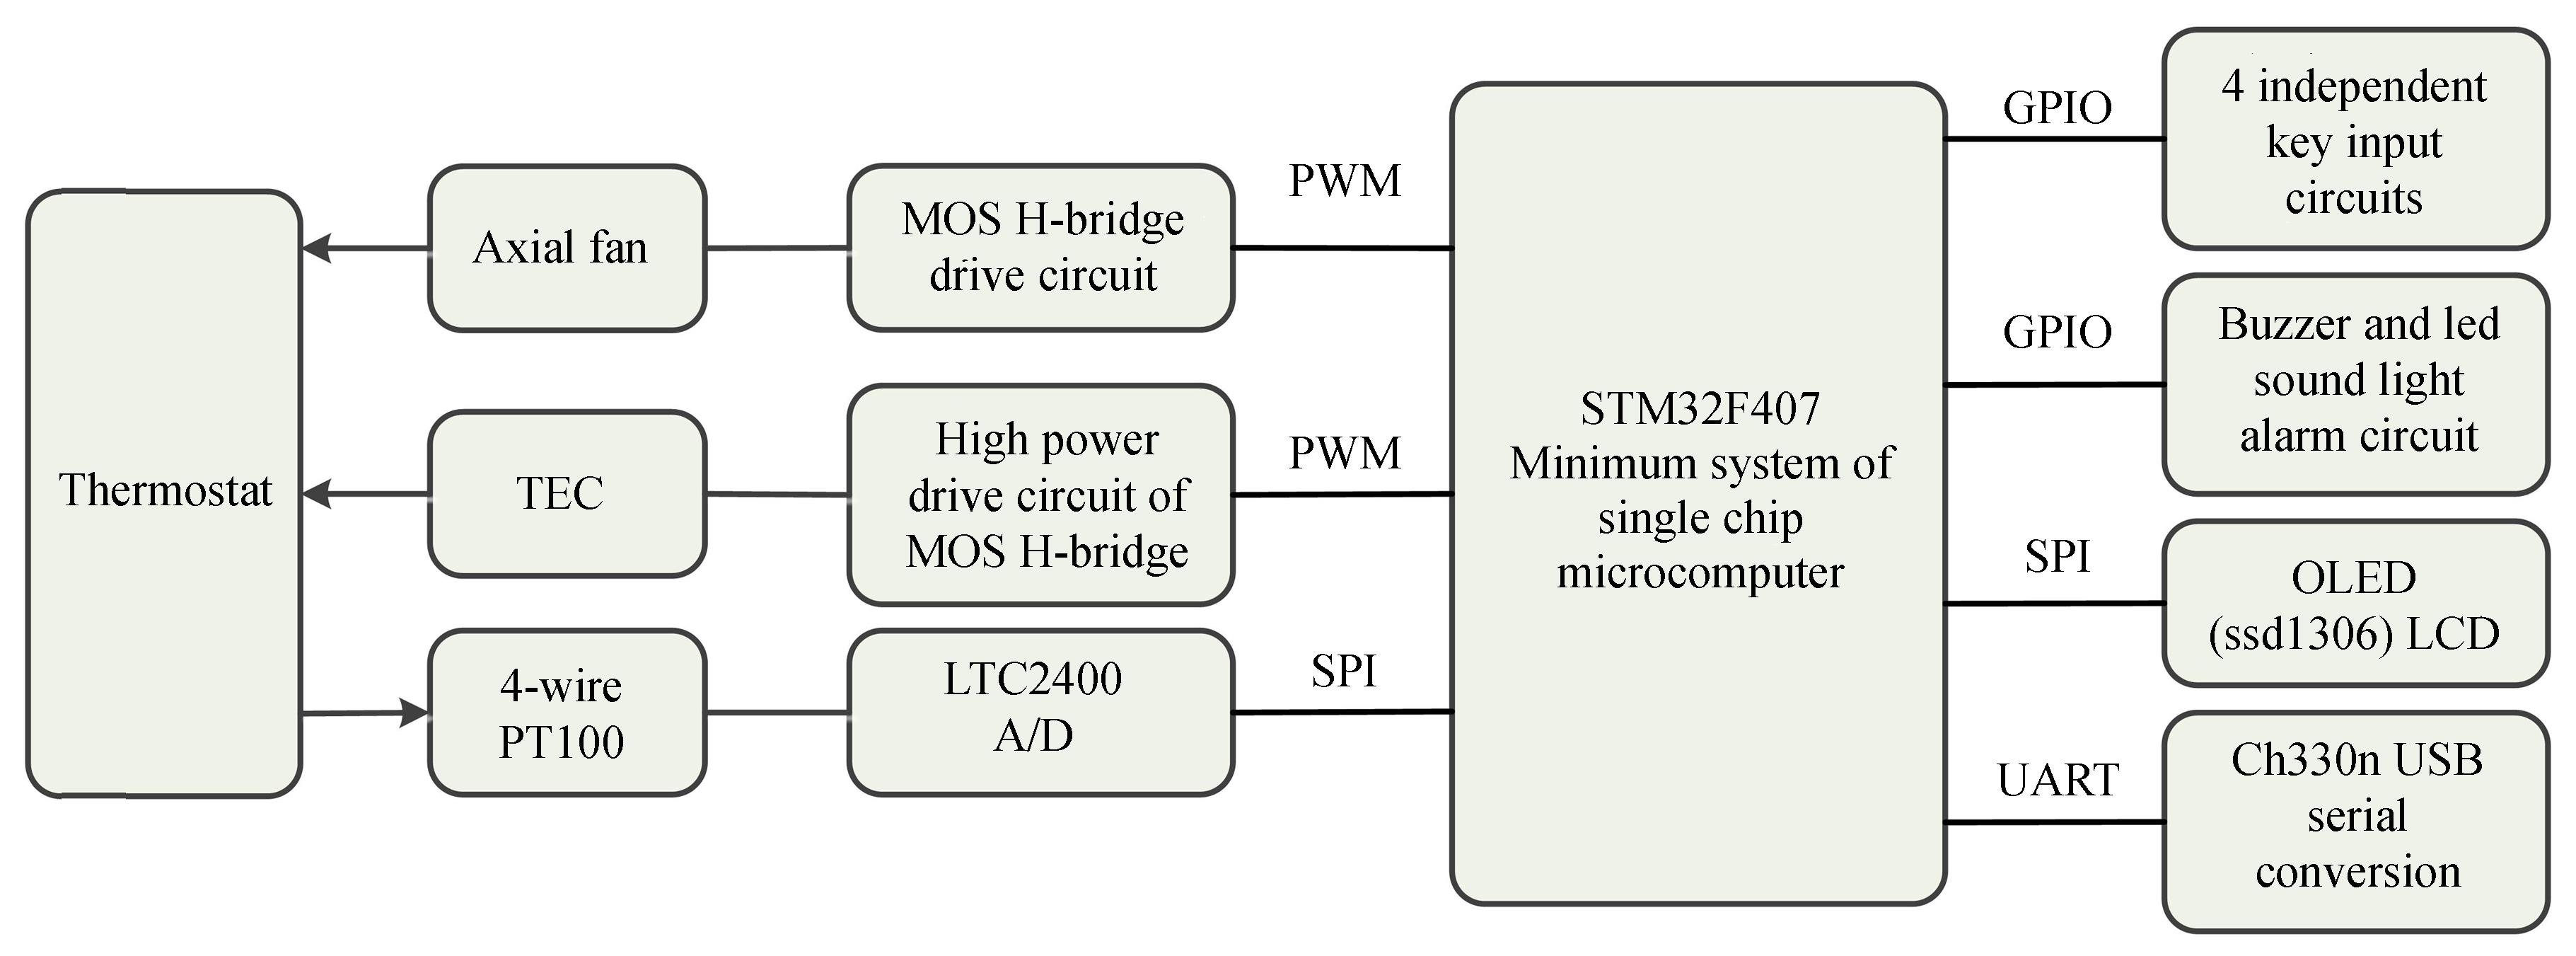
    Fig. 1. System design scheme
    Bootstrap current source
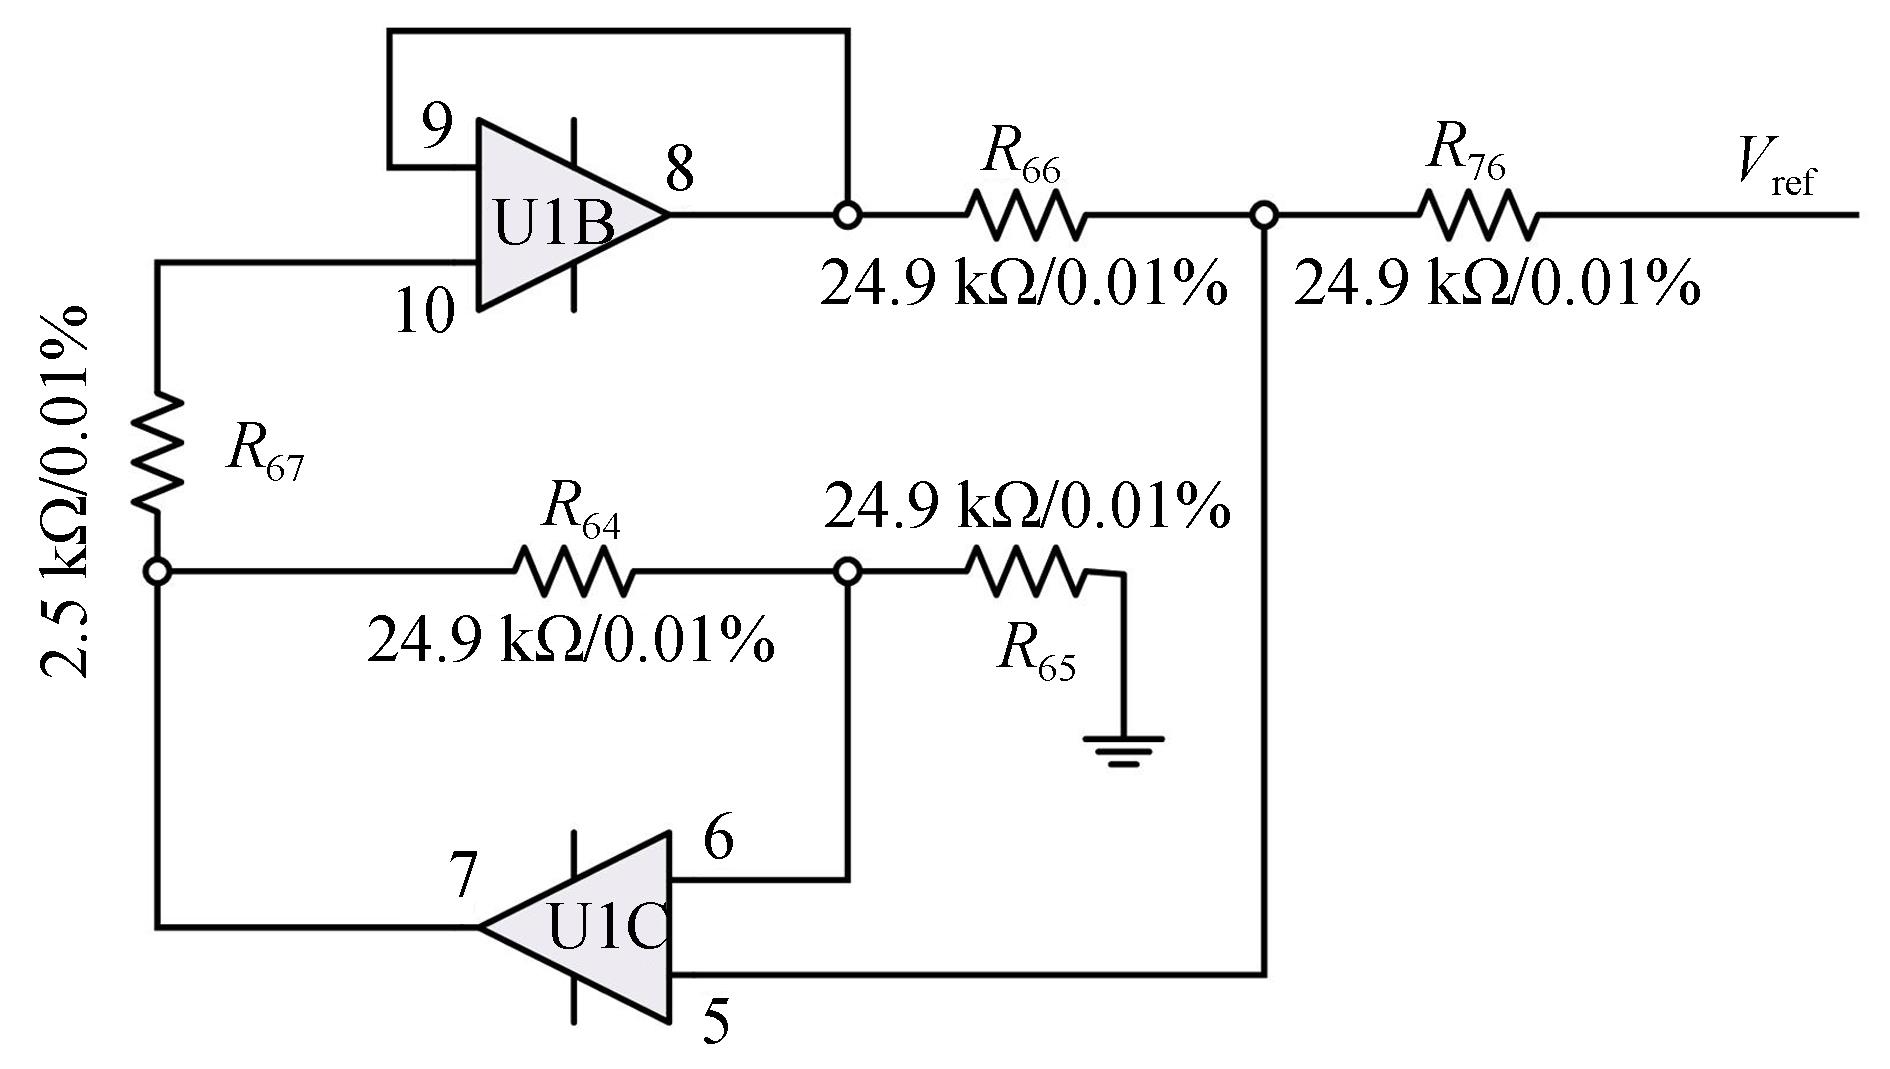
    Fig. 2. Bootstrap current source
    PT00 Resistance-temperature characteristic curve
    Fig. 3. PT00 Resistance-temperature characteristic curve
    Dual channel temperature acquisition and conditioning circuit
    Fig. 4. Dual channel temperature acquisition and conditioning circuit
    TEC temperature control system
    Fig. 5. TEC temperature control system
    System software diagram
    Fig. 6. System software diagram
    PID control diagram
    Fig. 7. PID control diagram
    Schematic of internal structure of temperature control box
    Fig. 8. Schematic of internal structure of temperature control box
    Temperature control experimental system
    Fig. 9. Temperature control experimental system
    Stability of temperature control system at 35℃
    Fig. 10. Stability of temperature control system at 35℃
    Change curves of measured values of temperature and concentration
    Fig. 11. Change curves of measured values of temperature and concentration
    1-hour variation curves of 7 different temperature sets
    Fig. 12. 1-hour variation curves of 7 different temperature sets
    Concentration and second harmonics at relative steady state
    Fig. 13. Concentration and second harmonics at relative steady state
    Time/hMeanRangeMinimumMaximumStd. deviationMedian absolute deviation
    1.0~2.015.9990.02015.98816.0080.0030.002
    3.3~4.320.0000.01719.99120.0080.0030.002
    5.3~6.323.9990.02323.98824.0110.0040.003
    7.5~8.527.9270.02427.91627.9400.0040.003
    9.5~10.531.9950.02731.98132.0080.0040.003
    11.5~12.535.9170.02935.90335.9320.0050.004
    13.5~14.539.9930.03539.97740.0120.0060.004
    Table 1. Selected temperature parameters in the stable period
    Xu LIU, Peng-shuai SUN, Xi YANG, Tao PANG, Hua XIA, Bian WU, Zhi-rong ZHANG, Zhi-feng SHU, Chi-min SHU. High Precision Temperature Control Design for TDLAS Gas Detection System[J]. Acta Photonica Sinica, 2020, 49(12): 93
    Download Citation