
Anying Chen, Haoran Zhu, Xiaoyong Ni, Guofeng Su. Pre-warning information dissemination models of different media under emergencies[J]. Chinese Physics B, 2020, 29(9):
- Chinese Physics B
- Vol. 29, Issue 9, (2020)
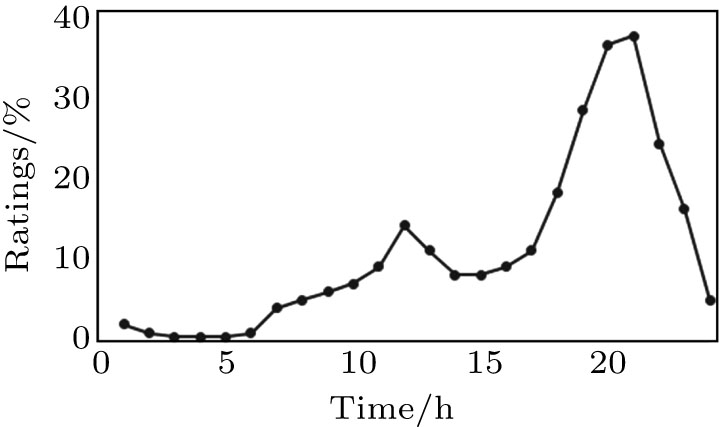
Fig. 1. TV ratings at different time.
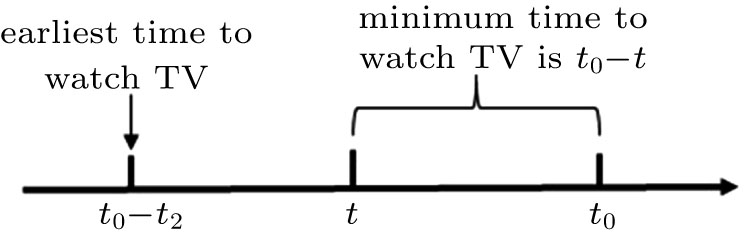
Fig. 2. Time relationship in TV dissemination model.
Fig. 3. Radio ratings at different time.
Fig. 4. Time relationship in radio dissemination model.
Fig. 5. The coverage ability for different media.
Fig. 6. The pre-warning coverage ability for different groups.
Fig. 7. Dissemination process of pre-warning issued at 2 : 00.
Fig. 8. Dissemination process of pre-warning issued at 7 : 00.
Fig. 9. Dissemination process of pre-warning issued at 12 : 00.
Fig. 10. Dissemination process of pre-warning issued at 17 : 00.
Fig. 11. Dissemination process of pre-warning issued at 22 : 00.
Fig. 12. Issue efficiency of different media at different time.
Fig. 13. The needed time of coverage reaching 90% for different media.
Fig. 14. The average comparison result.
Fig. 15. The comparison at different time: (a) issue at 2:00, (b) issue at 8:00, (c) issue at 14:00, (d) issue at 20:00.
| |||||||||||||||
Table 1. Pre-warning information dissemination media classification
|
Table 2. Proportion of elderly people in different populations.

Set citation alerts for the article
Please enter your email address
© Copyright 2018-2021 | Chinese Laser Press. All Rights Reserved 沪ICP备15018463号-20