
R. Rodríguez, G. Espinosa, J. M. Gil, F. Suzuki-Vidal, T. Clayson, C. Stehlé, P. Graham. Analysis of microscopic properties of radiative shock experiments performed at the Orion laser facility[J]. High Power Laser Science and Engineering, 2018, 6(2): 02000e36
- High Power Laser Science and Engineering
- Vol. 6, Issue 2, 02000e36 (2018)
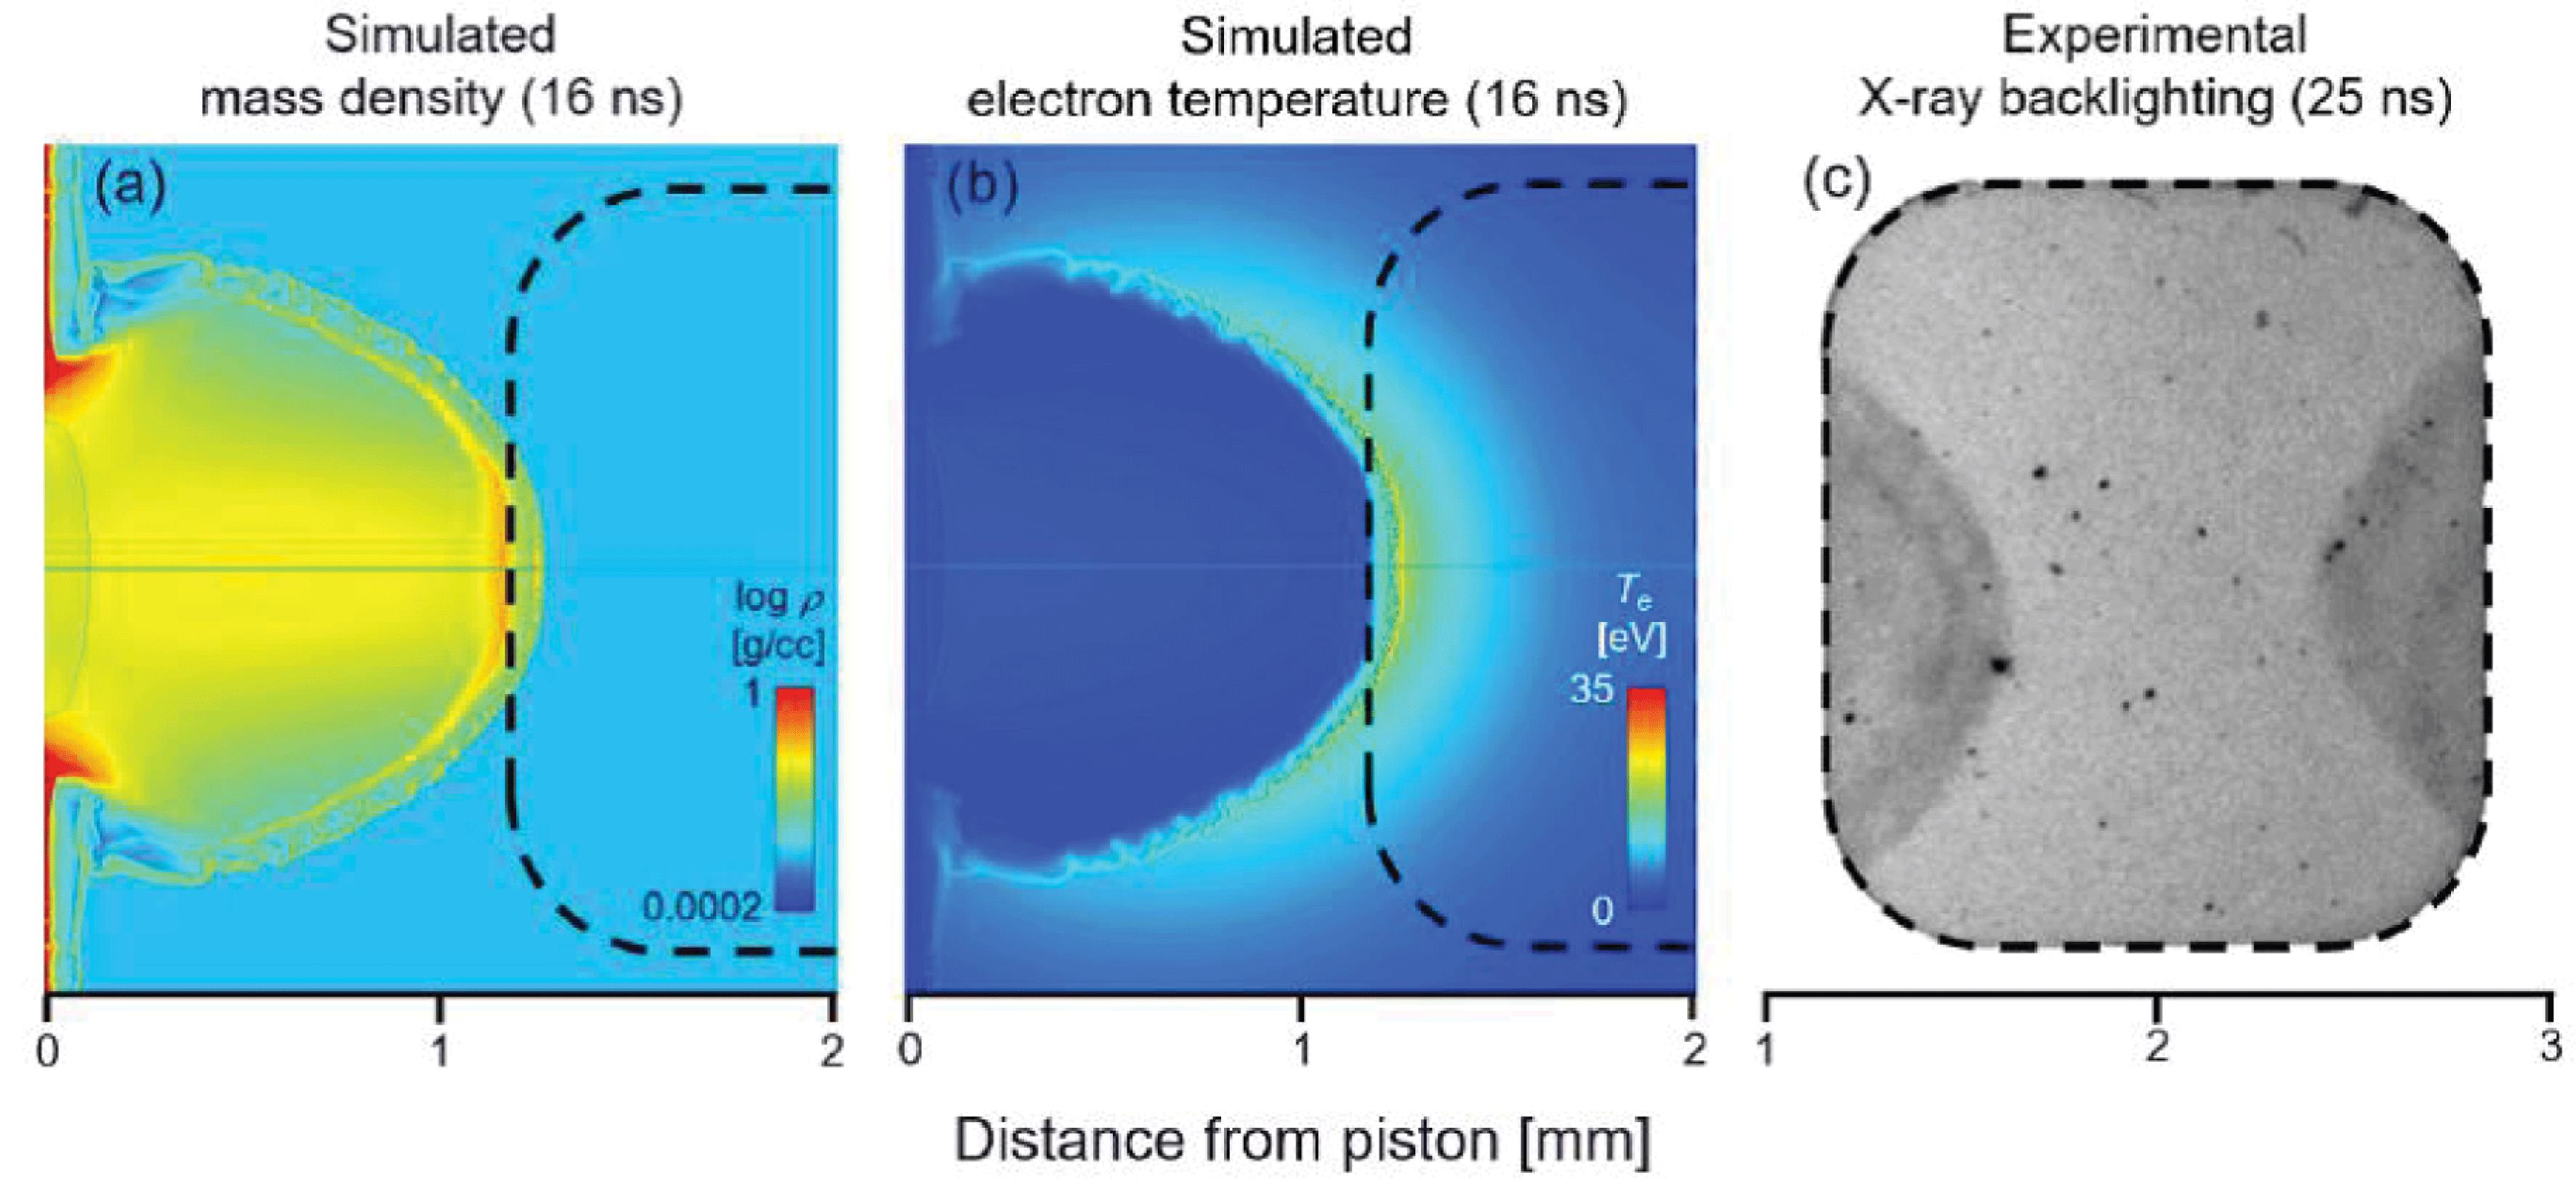
Fig. 1. (a) Simulated mass density and (b) simulated electron temperature at 16 ns. (c) Experimental X-ray backlighting at 25 ns. The dashed lines mark the position of the diagnostic window on the gas-cell targets.
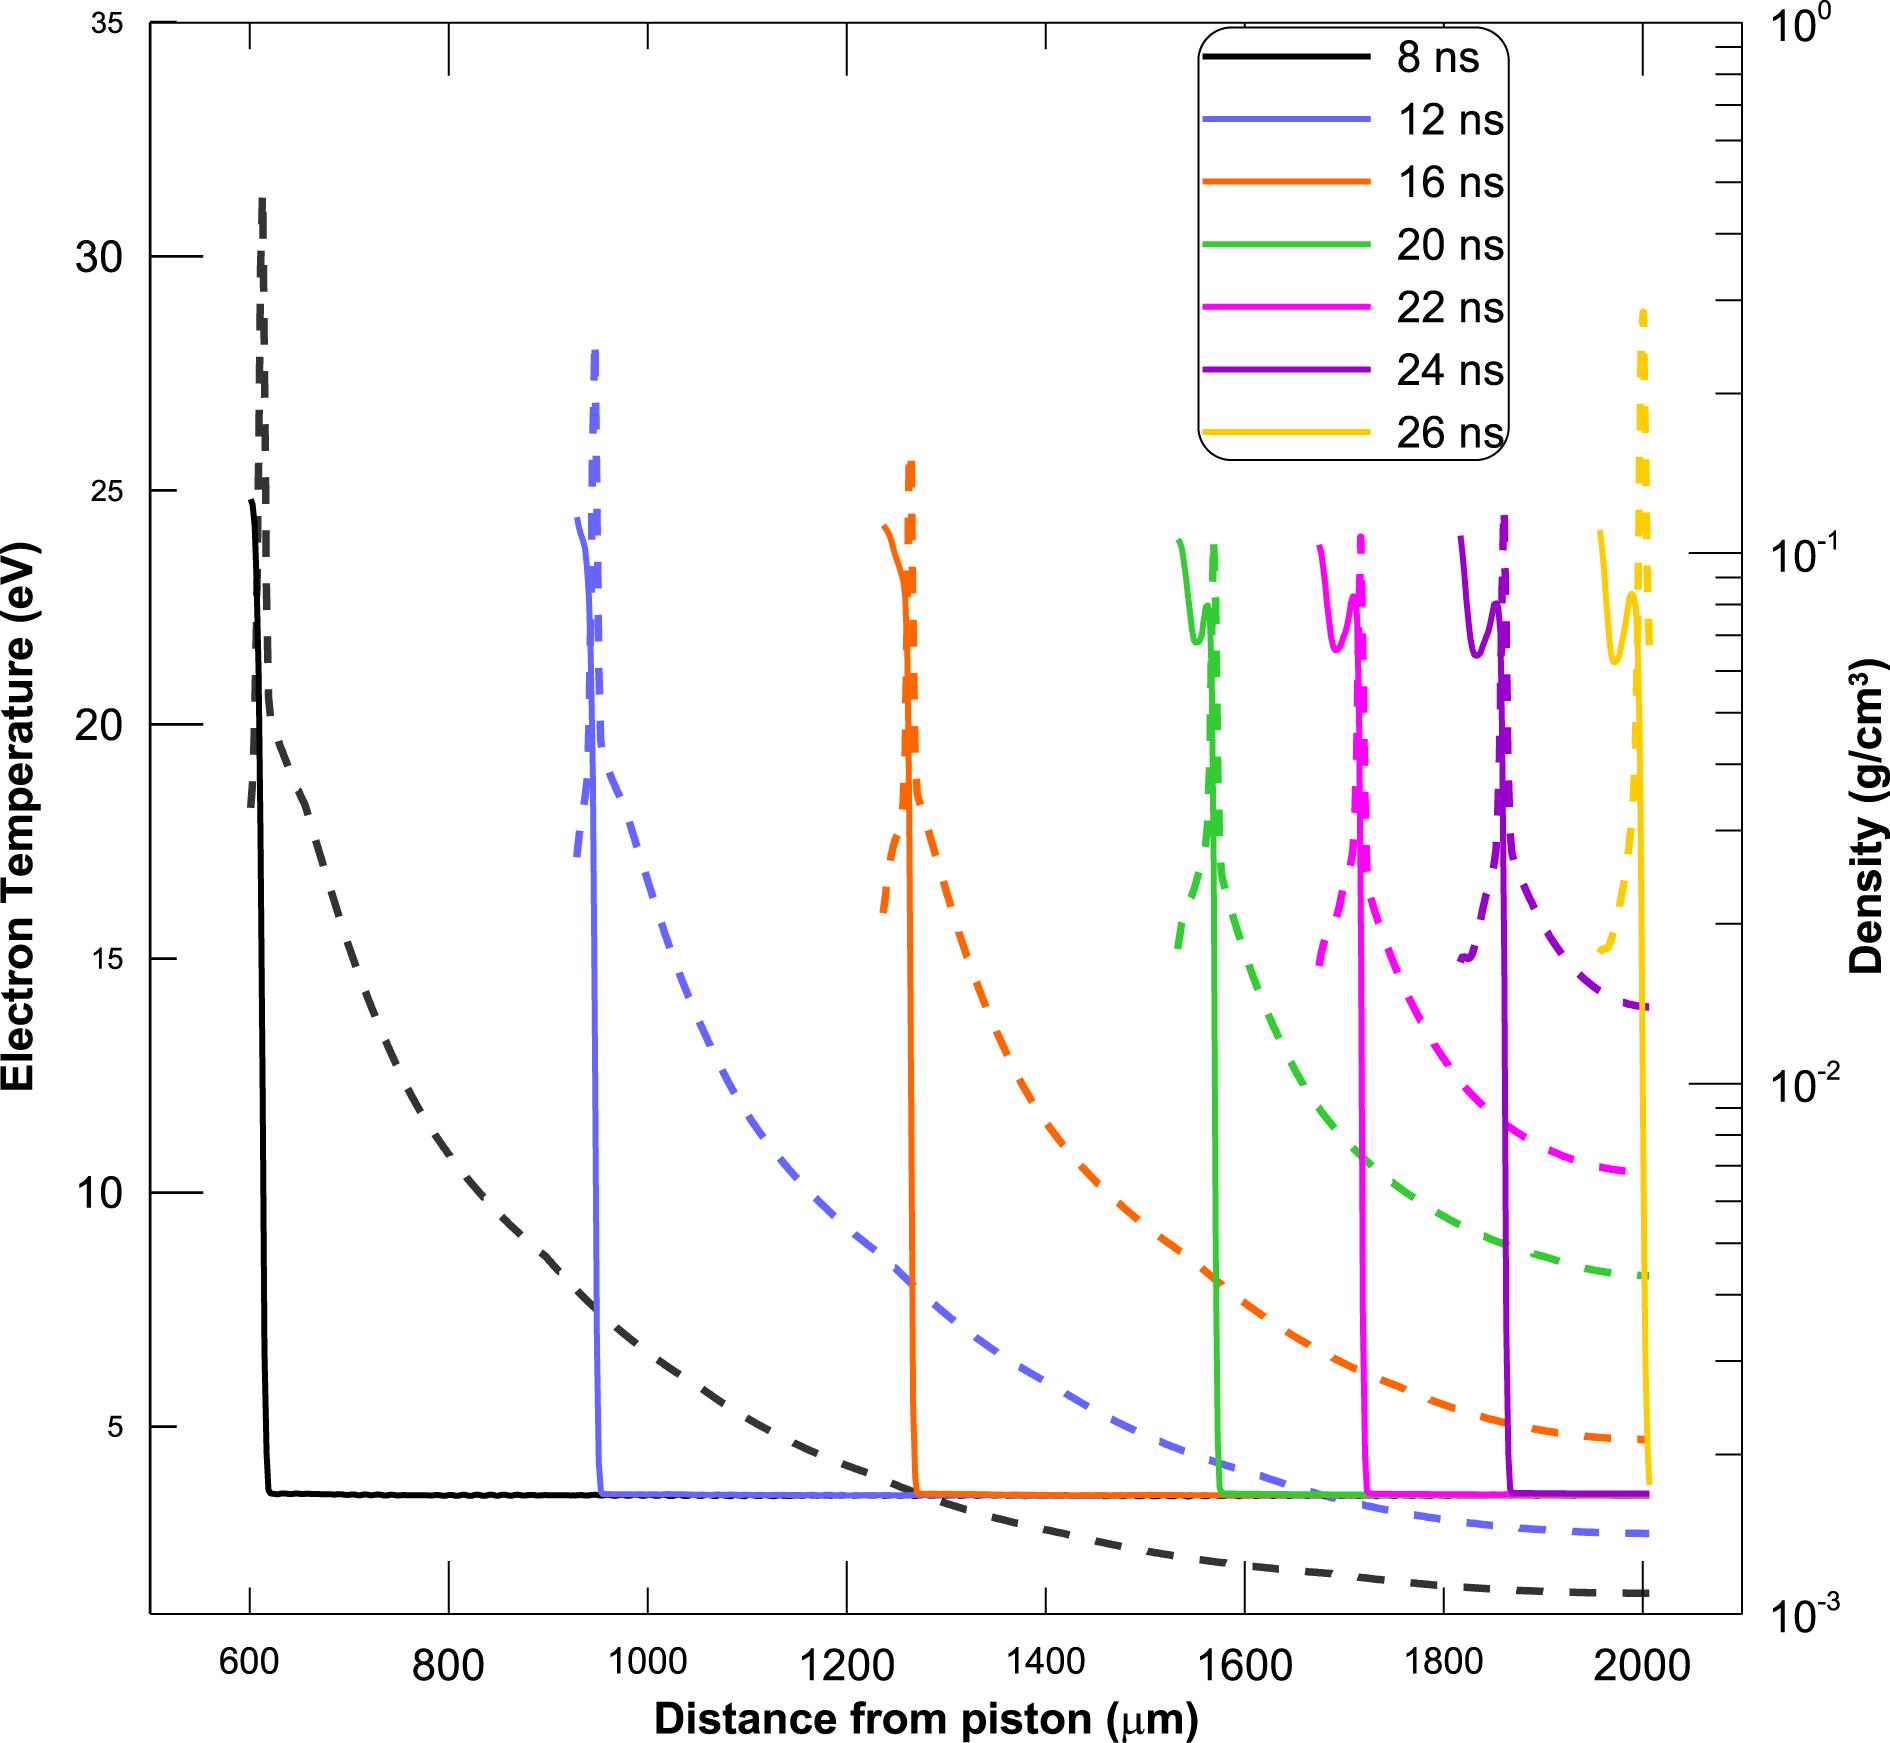
Fig. 2. Electron temperature (dashed lines) and mass density profiles of one of the radiative shocks as a function of time and position obtained with the 2D radiative-hydrodynamic simulation.
Fig. 3. Axial electron temperature (orange) and mass density (blue) profiles of one of the radiative shocks at 8 ns and 16 ns, deduced from the 2D radiation-hydrodynamics simulations. An electron density profile is also represented in green at 16 ns.
Fig. 4. Charge state distribution (CSD) as a function of the electron temperature at the mass density in the radiative precursor (
 ).
).
). Fig. 5. Division of layers of the radiative precursor at  . Layer 1 is located closest to shock front, and layer 4 furthest.
. Layer 1 is located closest to shock front, and layer 4 furthest. Fig. 6. Specific intensities of the radiation emitted by different layers in the radiative precursor.
Fig. 7. Monochromatic opacities of the radiative precursor at four characteristic temperatures ( ,
,  ,
,  and 20 eV).
, , and 20 eV). Fig. 8. (a) Charge state distributions and (b) their monochromatic emissivities for two plasma conditions of the post-shock medium at 8 ns.
Fig. 9. Specific intensity of the radiation emitted by the post-shock medium at 8 ns.

Set citation alerts for the article
Please enter your email address
© Copyright 2018-2021 | Chinese Laser Press. All Rights Reserved 沪ICP备15018463号-20