• Chinese Journal of Lasers
  • Vol. 50, Issue 12, 1202303 (2023)
Fei Liu1、2, Yichuan Tang1, Haiqiong Xie1、2、*, Chenke Zhang2, and Junjie Chen1
Author Affiliations
  • 1School of Advanced Manufacturing Engineering, Chongqing University of Posts and Telecommunications, Chongqing 400065, China
  • 2Sports Medicine Center, First Affiliated Hospital of the Army Medical University, Chongqing 400037, China
  • show less
    DOI: 10.3788/CJL221026 Cite this Article Set citation alerts
    Fei Liu, Yichuan Tang, Haiqiong Xie, Chenke Zhang, Junjie Chen. Optimization of Structure and Performance of Minimal Surface Lattice Formed by Selective Laser Melting[J]. Chinese Journal of Lasers, 2023, 50(12): 1202303 Copy Citation Text show less
    Four kinds of lattice structure designs. (a) Unit cells with different relative densities; (b) relationship between parameter t and relative density ρ*
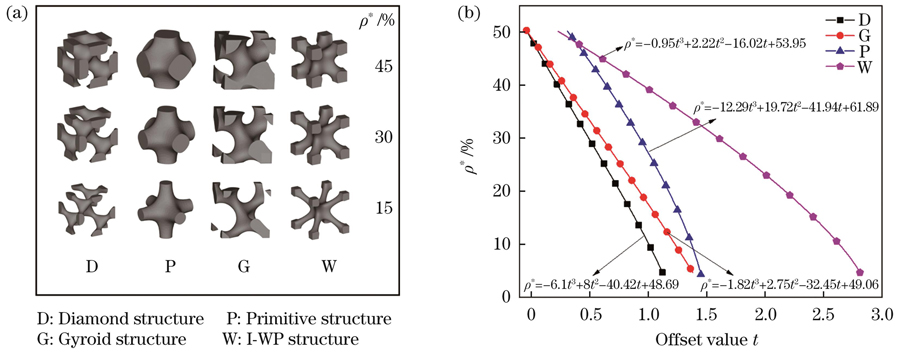
    Fig. 1. Four kinds of lattice structure designs. (a) Unit cells with different relative densities; (b) relationship between parameter t and relative density ρ*
    Design method of surface offset for I-WP lattice structure by Boolean operation
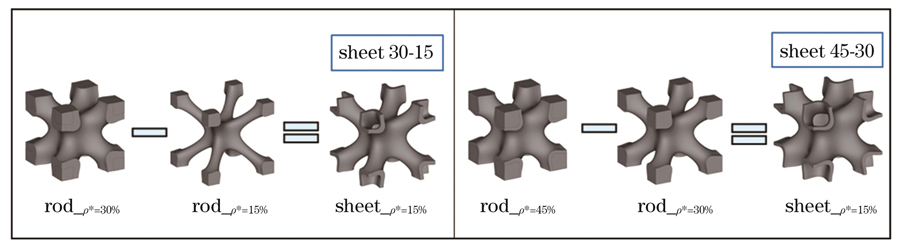
    Fig. 2. Design method of surface offset for I-WP lattice structure by Boolean operation
    Diamond, Gyroid, Primitive and I-WP design and manufactured rod structure (rod 15) and sheet structures (sheet 30-15 and sheet 45-30)
    Fig. 3. Diamond, Gyroid, Primitive and I-WP design and manufactured rod structure (rod 15) and sheet structures (sheet 30-15 and sheet 45-30)
    Morphology and particle size distribution of Ti-6Al-4V powder used in experiment. (a) SEM image of Ti-6Al-4V powder;(b) particle size distribution
    Fig. 4. Morphology and particle size distribution of Ti-6Al-4V powder used in experiment. (a) SEM image of Ti-6Al-4V powder;(b) particle size distribution
    Deformation behaviors of lattices structure during experimental compression
    Fig. 5. Deformation behaviors of lattices structure during experimental compression
    Division of tetrahedral mesh C3D10M of I-WP sheet 45-30 lattice structure in FEM (the right image is partially enlarged morphology of left image)
    Fig. 6. Division of tetrahedral mesh C3D10M of I-WP sheet 45-30 lattice structure in FEM (the right image is partially enlarged morphology of left image)
    Compressive stress-strain curves of Diamond, Primitive, Gyroid and I-WP lattice structures. (a) Diamond lattice structure;(b) Primitive lattice structure; (c) Gyroid structure; (d) I-WP lattice structure
    Fig. 7. Compressive stress-strain curves of Diamond, Primitive, Gyroid and I-WP lattice structures. (a) Diamond lattice structure;(b) Primitive lattice structure; (c) Gyroid structure; (d) I-WP lattice structure
    Deformation of Diamond, Primitive, Gyroid and I-WP lattice structures with rod 15, sheet 30-15 and sheet 45-30 types in compression test
    Fig. 8. Deformation of Diamond, Primitive, Gyroid and I-WP lattice structures with rod 15, sheet 30-15 and sheet 45-30 types in compression test
    Comparison of stress-strain curves obtained by physical compression test and finite element simulation. (a) Diamond lattice structures; (b) Primitive lattice structures; (c) Gyroid structures; (d) I-WP lattice structures
    Fig. 9. Comparison of stress-strain curves obtained by physical compression test and finite element simulation. (a) Diamond lattice structures; (b) Primitive lattice structures; (c) Gyroid structures; (d) I-WP lattice structures
    Comparison of ultimate strength obtained by numerical simulation and compression test. (a) Diamond lattice structures;(b) Primitive lattice structures; (c) Gyroid structures; (d) I-WP lattice structures
    Fig. 10. Comparison of ultimate strength obtained by numerical simulation and compression test. (a) Diamond lattice structures;(b) Primitive lattice structures; (c) Gyroid structures; (d) I-WP lattice structures
    Simulated plastic deformation of Diamond lattice structures in compression process
    Fig. 11. Simulated plastic deformation of Diamond lattice structures in compression process
    Simulated plastic deformation of Primitive lattice structures in compression process
    Fig. 12. Simulated plastic deformation of Primitive lattice structures in compression process
    Simulated plastic deformation of Gyroid lattice structure in compression process
    Fig. 13. Simulated plastic deformation of Gyroid lattice structure in compression process
    Simulated plastic deformation of I-WP lattice structures in compression process
    Fig. 14. Simulated plastic deformation of I-WP lattice structures in compression process
    Cumulative energy absorption and fitting curves of each lattice structures. (a) Diamond lattice structures; (b) Primitive lattice structures; (c) Gyroid structures; (d) I-WP lattice structures
    Fig. 15. Cumulative energy absorption and fitting curves of each lattice structures. (a) Diamond lattice structures; (b) Primitive lattice structures; (c) Gyroid structures; (d) I-WP lattice structures
    Cumulative energy absorption and plateau stress of each structure for strain of 50%
    Fig. 16. Cumulative energy absorption and plateau stress of each structure for strain of 50%
    ElementMass fraction /%
    TiBalance
    Al5.5-6.75
    V3.5-4.5
    O<0.2
    N<0.05
    C<0.08
    H<0.015
    Fe<3
    Table 1. Chemical composition of Ti-6Al-4V alloy powder
    NomenclatureDescription
    ρ* /%Relative density of the lattice structures
    σ /MPaStress,calculated by dividing the load by the apparent cross-sectional area
    ε /%Stain,calculated by dividing the displacement by sample’s height
    E /GPaYoung’s modulus of the lattice structure,which is the slope of linear phase of stress-strain curve
    σs /MPaYield strength of the lattice structure,identified with the compressive 0.2% offset stress
    εs /%Yield strain,the strain produced when yield strength is reached
    σb /MPaUltimate strength of the lattice structure,measured as the first peak on the stress-strain curve
    εb /%Ultimate strain,the strain produced when the ultimate strength is reached
    σpl /MPaPlateau stress,average stress from ε=20% to ε=40%
    WV /(MJ·m-3Cumulative energy absorption per unit volume up to ε=50%
    Table 2. Mechanical properties of TPMS lattice structures and corresponding descriptions
    ParameterValue
    A /Pa997
    B /MPa746
    N0.325
    D10.005
    D20.43
    D3-0.48
    Table 3. Performance parameters set in Johnson-Cook model of SLM manufacturing Ti-6Al-4V
    Structureσs /MPaεs /%σb /MPaεb /%E /MPa
    D rod 1539.34±1.234.9448.84±0.219.35982.500±14.654
    D sheet 30-1570.67±1.115.2186.68±0.1211.131755.196±21.988
    D sheet 45-3091.27±0.775.14112.51±0.0911.132219.714±22.124
    P rod 1552.96±2.113.8967.86±0.268.871932.197±33.484
    P sheet 30-1584.50±1.035.1599.79±0.148.742054.919±3.398
    P sheet 45-3067.43±1.314.7880.34±0.138.241715.439±19.954
    G rod 1538.12±1.194.5251.40±0.149.081137.651±45.607
    G sheet 30-1566.02±3.004.1586.72±0.039.361996.746±63.557
    G sheet 45-3080.24±0.705.03103.59±0.259.252121.357±15.393
    W rod 1524.96±0.874.2632.37±0.228.99681.473±1.303
    W sheet 30-1562.15±1.214.5877.92±0.1510.441677.287±2.883
    W sheet 45-3093.89±0.966.16111.64±0.2410.122181.133±158.558
    Table 4. Compressive properties of each lattice structure
    Fei Liu, Yichuan Tang, Haiqiong Xie, Chenke Zhang, Junjie Chen. Optimization of Structure and Performance of Minimal Surface Lattice Formed by Selective Laser Melting[J]. Chinese Journal of Lasers, 2023, 50(12): 1202303
    Download Citation