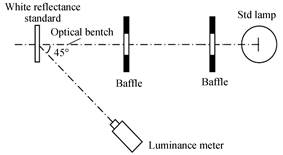
Fig. 1. Block diagram of luminance unit realization based on white reflectance standard and luminous intensity standard lamp
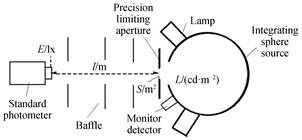
Fig. 2. Block diagram of luminance unit realization based on uniform luminance source
Fig. 3. Picture of adjustable high level uniform source
Fig. 4. Picture of alignment testing of setup
Fig. 5. Stability of light source in 30 min by experiment
Fig. 6. Uniformity measurement points distribution diagram of luminance source export plane
Fig. 7. Measurement data of source angle character
| Parameter | Value | Expanded uncertainty(k=2) | | Diameter/mm | 17.992 | 0.002 | | Roundness/mm | 0.006 | 0.002 | | Area/mm2 | 254.25 | 0.16 | | Measuring conditions | Collect 25 points evenly on the edge of aperture to calculate the diameter and roundness |
|
Table 1. Measuring result of precision limiting aperture
| Measurement point | Luminance/(cd·m-2) | Measurement point | Luminance/(cd·m-2) | | 1 | 1 028 | 6 | 1 028 | | 2 | 1 030 | 7 | 1 029 | | 3 | 1 027 | 8 | 1 027 | | 4 | 1 028 | 9 | 1 029 | | 5 | 1 027 | Max deviation of uniformity | 0.29% |
|
Table 2. Uniformity measurement data of luminance source export plane
| Display value of standard photometer/nA | Nonlinear coefficient | | SA | SB | SAB | SA+B | | 0.102 5 | 0.098 5 | 0.201 4 | 0.201 0 | 1.002 0 | | 0.180 5 | 0.172 7 | 0.353 4 | 0.353 2 | 1.000 6 | | 0.339 2 | 0.346 5 | 0.685 3 | 0.685 7 | 0.999 4 | | 0.721 5 | 0.722 1 | 1.441 2 | 1.443 6 | 0.998 3 | | 1.459 8 | 1.397 5 | 2.854 5 | 2.857 3 | 0.999 0 | | 3.114 6 | 3.102 5 | 6.211 8 | 6.217 1 | 0.999 1 | | 6.296 5 | 6.139 5 | 12.44 | 12.436 | 1.000 3 | | 12.614 | 12.266 | 24.915 | 24.880 | 1.001 4 | | 25.080 | 24.902 | 50.008 | 49.981 | 1.000 5 | | 50.707 | 50.077 | 100.80 | 100.78 | 1.000 2 | | 98.837 | 97.097 | 196.03 | 195.93 | 1.000 5 |
|
Table 3. Nonlinearity measurement data of standard photometer
| Luminance standard value /(cd·m-2) | Display value of standard luminance meter /(cd·m-2) | Relative indication error | | 2 118×100 | 21 170 | -0.05% | | 1 536×100 | 15 350 | -0.07% | | 1 032×100 | 10 310 | -0.10% | | 5 140×10 | 51 370 | -0.06% | | 1 018×10 | 10 170 | -0.10% | | 4 976.5 | 4 981.1 | 0.09% | | 1 109.2 | 1 110.1 | 0.08% | | 107.59 | 107.73 | 0.13% | | 10.015 | 10.007 | 0.10% |
|
Table 4. 1×101~2×10⁵ cd/m2 unit realization data
| Luminance source method/(cd·m-2) | Standard lamp and reflectance plate method/(cd·m-2) | Relative deviation/% | | 10.03 | 10.05 | 0.20% | | 50.11 | 50.04 | -0.14% | | 100.6 | 100.5 | -0.10% | | 499.0 | 498.1 | -0.18% |
|
Table 5. Comparison between two realization methods
| Index | Luminance value/(cd·m-2) | Index | Luminance value/(cd·m-2) | | 1 | 4 988 | 6 | 4 990 | | 2 | 4 988 | 7 | 4 990 | | 3 | 4 989 | 8 | 4 989 | | 4 | 4 990 | 9 | 4 990 | | 5 | 4 989 | 10 | 4 988 | | Relative standard deviation | 0.02% |
|
Table 6. Repeatability data of system
| Source of uncertainty | Relative uncertainty | Sensitivity coefficient | Standard uncertainty component | Type of uncertainty | | Repeatability | 0.02% | 1 | 0.02% | A | | Scatter light | Negligible | / | / | B | | Illuminance value | 0.25% | 1 | 0.25% | B | | Nonlinearity of standard photometer | 0.14% | 1 | 0.14% | B | | Spectral mismatch of detector | Negligible | / | / | B | | Distance measurement | 0.04% | 2 | 0.08% | B | | Alignment of detector and aperture | 0.06% | 2 | 0.12% | B | | Area of aperture | 0.06% | -1 | 0.06% | B | | Combined standard uncertainty | 0.33% | | Relative expanded uncertainty | 0.7%, k=2 |
|
Table 7. Uncertainty budgets of the luminance unit realization system based on luminance source