• Journal of Natural Resources
  • Vol. 35, Issue 2, 329 (2020)
Yang SHEN1, Cong-cong WANG2, Chao GAO2、*, and Lei DING1
Author Affiliations
  • 1Institute of Business Foreign Languages, Ningbo Polytechnic, Ningbo 315800, Zhejiang, China
  • 2Department of Geography and Spatial Information Techniques, Ningbo University, Ningbo 315211, Zhejiang, China
  • show less
    DOI: 10.31497/zrzyxb.20200207 Cite this Article
    Yang SHEN, Cong-cong WANG, Chao GAO, Lei DING. Spatio-temporal distribution and its influencing factors of carbon emissions in economic zone of Zhejiang Bay Area based on urbanization[J]. Journal of Natural Resources, 2020, 35(2): 329 Copy Citation Text show less
    Spatial and temporal variations of carbon emissions in the bay area economic zone of Zhejiang province
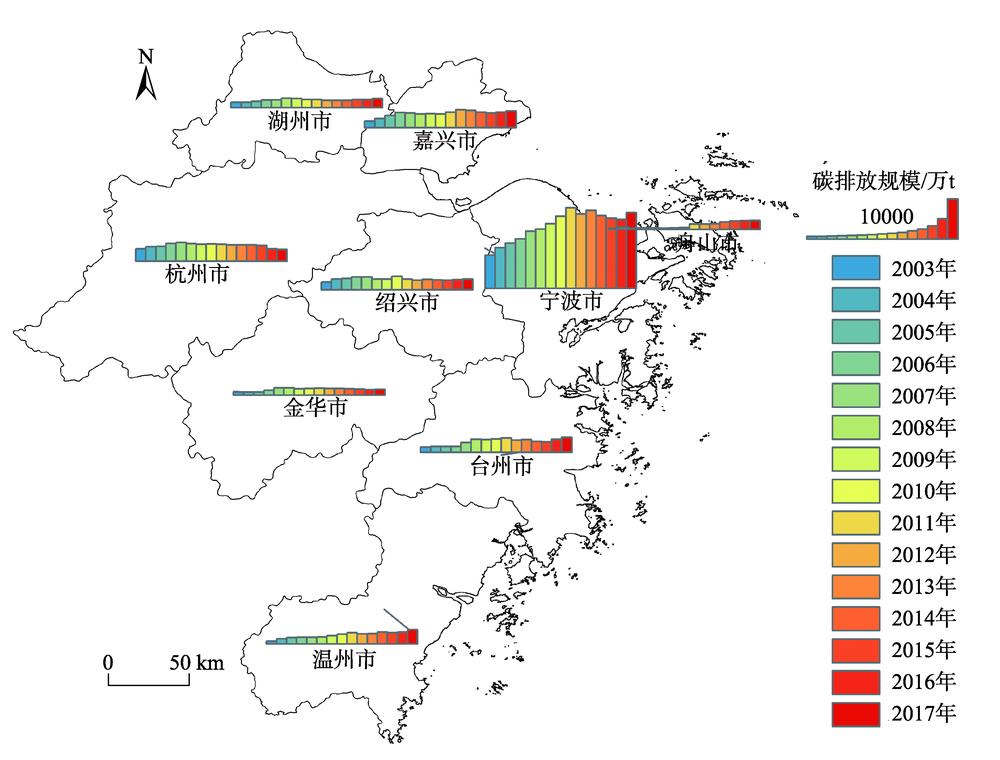
    Fig. 1. Spatial and temporal variations of carbon emissions in the bay area economic zone of Zhejiang province
    Spatial and temporal variations of carbon emissions intensity in the bay area economic zone of Zhejiang province
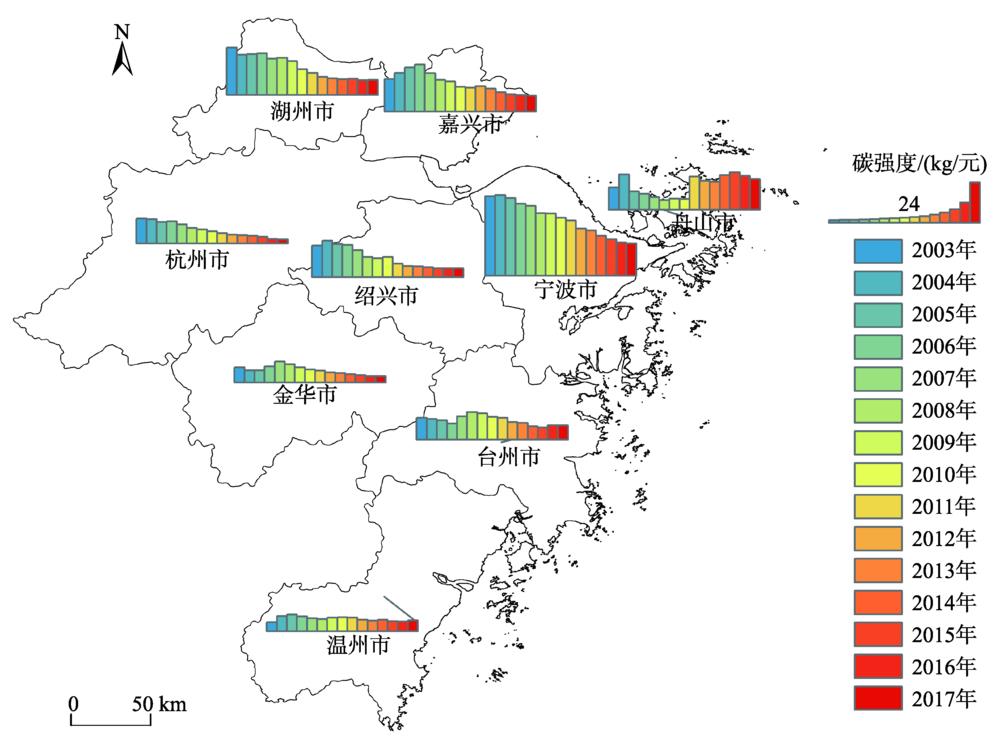
    Fig. 2. Spatial and temporal variations of carbon emissions intensity in the bay area economic zone of Zhejiang province
    Time series change trend of GTWR regression coefficients
    Fig. 3. Time series change trend of GTWR regression coefficients
    Spatial distribution patterns of the factor coefficient in the bay area economic zone of Zhejiang province
    Fig. 4. Spatial distribution patterns of the factor coefficient in the bay area economic zone of Zhejiang province
    变量变量含义单位均值标准差最小值最大值
    碳强度CI单位GDP二氧化碳排放量kg/元13.649.172.4247.16
    城市化水平UR城镇常住人口占总人口比例%59.5511.1717.5676.8
    能源消费结构ECS煤炭消费占能源消费总量比例%60.7310.4439.2884.24
    土地利用CON城市建设用地占市区面积比例%9.655.621.7830.15
    经济发展水平PGDP人均GDP万元63113.3726779.1921335135113
    产业结构2ND第二产业产值占GDP比例%49.956.563360
    人口集聚PDEN单位面积常住人口数人/km2606.6166.4212.081189.27
    对外开放程度OPEN外商直接投资万美元140267.71619613120720900
    技术进步EI单位GDP能耗吨标准煤/万元0.680.190.341.18
    Table 1. Definition and the statistical description of all relevant variables used in the study
    模型OLSGTWR
    AIC271.6919146.6570
    R20.51780.9747
    AIC变化量0125.0349
    R2变化量00.4570
    Table 2. Index of model evaluation
    变量最小值最大值平均值中值标准差
    PGDP-3.77785.95420.90070.67931.7537
    OPEN-0.73144.38810.68190.27121.1031
    2ND-2.51472.6651-0.6059-0.81700.8839
    UR-0.73693.31440.1508-0.03660.7089
    EI-0.50051.23280.16730.09980.4375
    CON-0.59751.0518-0.0225-0.04790.2983
    ECS-0.56480.73990.17280.23780.2705
    PDEN-0.37420.6028-0.0256-0.03440.1290
    Table 3. Descriptive statistics of regression coefficients of influencing factors
    Yang SHEN, Cong-cong WANG, Chao GAO, Lei DING. Spatio-temporal distribution and its influencing factors of carbon emissions in economic zone of Zhejiang Bay Area based on urbanization[J]. Journal of Natural Resources, 2020, 35(2): 329
    Download Citation