• Chinese Journal of Lasers
  • Vol. 48, Issue 10, 1002001 (2021)
Pengjun Tang1、2、3, Taiqi Yan2, Peiyong Li1、2、3, Shaoqing Guo2, Ruikun Chu4, and Bingqing Chen2、*
Author Affiliations
  • 1Institute of Aluminum Alloy, AECC Beijing Institute of Aeronautical Materials, Beijing 100095, China
  • 23D Printing Research and Engineering Technology Center, AECC Beijing Institute of Aeronautical Materials, Beijing 100095, China
  • 3Beijing Engineering Research Center of Advanced Aluminum Alloys and Applications, Beijing 100095, China
  • 4Falcon Fast Manufacturing Technology Co., Ltd., Wuxi, Jiangsu 214145, China
  • show less
    DOI: 10.3788/CJL202148.1002001 Cite this Article Set citation alerts
    Pengjun Tang, Taiqi Yan, Peiyong Li, Shaoqing Guo, Ruikun Chu, Bingqing Chen. Microstructures and Fracture Toughness of Annealed AlSi10Mg Alloy Formed by Selective Laser Melting[J]. Chinese Journal of Lasers, 2021, 48(10): 1002001 Copy Citation Text show less
    Schematic of scanning strategy for selective laser melting
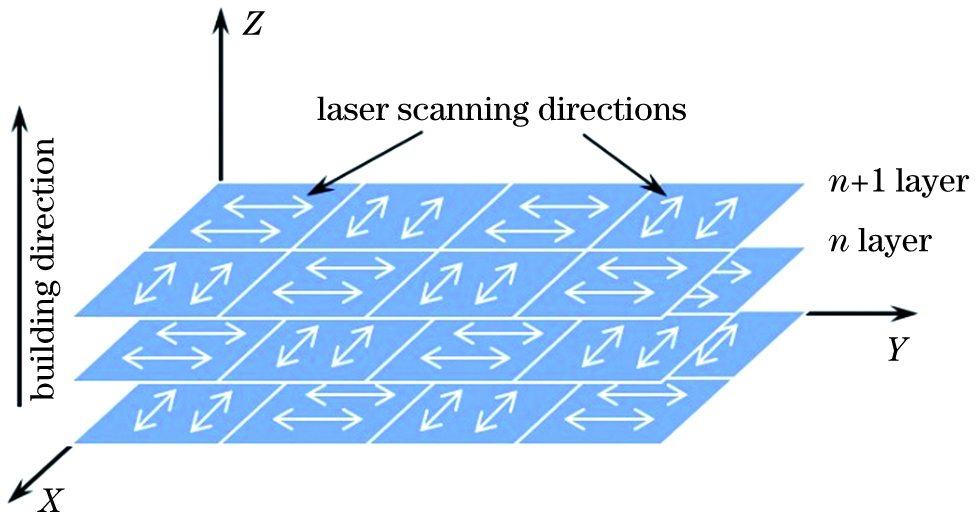
    Fig. 1. Schematic of scanning strategy for selective laser melting
    Sketch map of tensile samples and compact tensile specimens
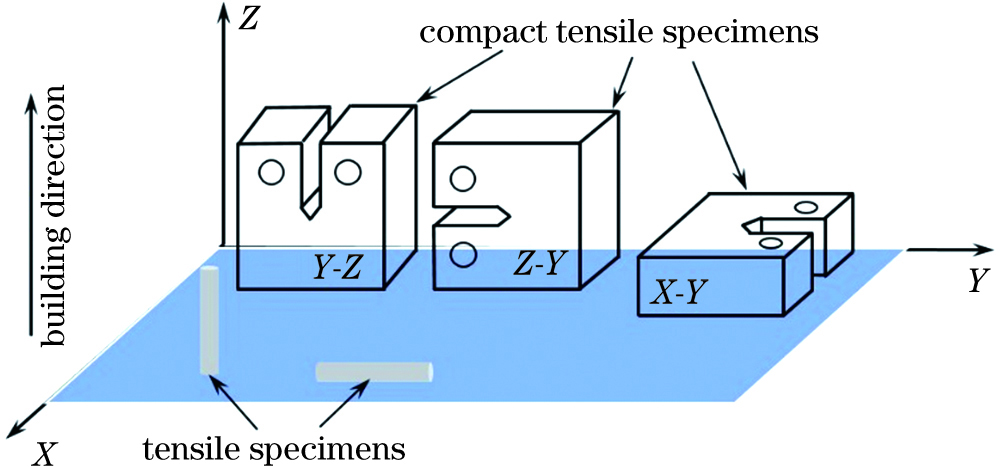
    Fig. 2. Sketch map of tensile samples and compact tensile specimens
    Microstructures of annealed alloy. (a) Parallel to building direction; (b) perpendicular to building direction
    Fig. 3. Microstructures of annealed alloy. (a) Parallel to building direction; (b) perpendicular to building direction
    SEM morphologies of annealed alloy. (a) Parallel to building direction; (b) perpendicular to building direction
    Fig. 4. SEM morphologies of annealed alloy. (a) Parallel to building direction; (b) perpendicular to building direction
    Grain morphology and grain boundary distribution of annealed alloy. (a) Grain morphology parallel to building direction; (b) grain morphology perpendicular to building direction; (c) grain boundary distribution parallel to building direction; (d) grain boundary distribution perpendicular to building direction
    Fig. 5. Grain morphology and grain boundary distribution of annealed alloy. (a) Grain morphology parallel to building direction; (b) grain morphology perpendicular to building direction; (c) grain boundary distribution parallel to building direction; (d) grain boundary distribution perpendicular to building direction
    Load versus crack opening displacement curves of compact tensile specimens with different opening directions. (a) X-Y; (b) Y-Z; (c) Z-Y
    Fig. 6. Load versus crack opening displacement curves of compact tensile specimens with different opening directions. (a) X-Y; (b) Y-Z; (c) Z-Y
    Fracture graphs of over-load zone for compact tension specimens with different opening directions. (a)(d) X-Y; (b)(e) Y-Z; (c)(f) Z-Y
    Fig. 7. Fracture graphs of over-load zone for compact tension specimens with different opening directions. (a)(d) X-Y; (b)(e) Y-Z; (c)(f) Z-Y
    No.DirectionW /mmB /mma /mmb /mmRm /MPaRp0.2 /MPaσY /MPaRp0.2 /Rmm
    X-Y-1X-Y69.9734.6835.5134.46301.0187.0244.00.622.20
    X-Y-269.9835.2035.3834.60
    Y-Z-1Y-Z70.0135.1035.8434.17301.0187.0244.00.622.20
    Y-Z-269.9834.9735.5334.45
    Z-Y-1Z-Y69.9935.0035.5534.44300.5188.3244.40.632.20
    Z-Y-270.0135.0135.7734.24
    Table 1. Calculation parameters of fracture toughness for compact tensile specimens with different opening directions
    No.DirectionFQ /kNKQ /(MPam)2.5(KQ/Rp0.2)2 /mmFmax /kNFmax /FQJ /(kJ·m-2)CTOD /mm
    X-Y-1X-Y38.7441.81124.9747.7031.23436.060.81
    X-Y-239.0341.24121.5948.1191.23430.000.80
    Y-Z-1Y-Z38.2641.32122.0646.8191.22429.640.80
    Y-Z-238.0840.75118.7247.0981.24431.600.81
    Z-Y-1Z-Y36.3541.00118.5243.6731.20252.150.47
    Z-Y-234.7237.4899.0541.5791.20251.300.47
    Table 2. Test results of compact tensile specimens with different opening directions
    Pengjun Tang, Taiqi Yan, Peiyong Li, Shaoqing Guo, Ruikun Chu, Bingqing Chen. Microstructures and Fracture Toughness of Annealed AlSi10Mg Alloy Formed by Selective Laser Melting[J]. Chinese Journal of Lasers, 2021, 48(10): 1002001
    Download Citation