• High Power Laser Science and Engineering
  • Vol. 7, Issue 3, 03000e40 (2019)
Bao Du1, Hong-Bo Cai1、2、3、†, Wen-Shuai Zhang1, Shi-Yang Zou1, Jing Chen1、2、3, and Shao-Ping Zhu1、4、5、†
Author Affiliations
  • 1Institute of Applied Physics and Computational Mathematics, Beijing 100094, China
  • 2HEDPS, Center for Applied Physics and Technology, Peking University, Beijing 100871, China
  • 3IFSA Collaborative Innovation Center, Shanghai Jiao Tong University, Shanghai 200240, China
  • 4STPPL, Research Center of Laser Fusion, China Academy of Engineering Physics, Mianyang 621900, China
  • 5Graduate School, China Academy of Engineering Physics, Beijing 100088, China
  • show less
    DOI: 10.1017/hpl.2019.30 Cite this Article Set citation alerts
    Bao Du, Hong-Bo Cai, Wen-Shuai Zhang, Shi-Yang Zou, Jing Chen, Shao-Ping Zhu. A demonstration of extracting the strength and wavelength of the magnetic field generated by the Weibel instability from proton radiography[J]. High Power Laser Science and Engineering, 2019, 7(3): 03000e40 Copy Citation Text show less
    Schematic diagram of proton radiography of a two-dimensionally isotropic and stochastic magnetic field.
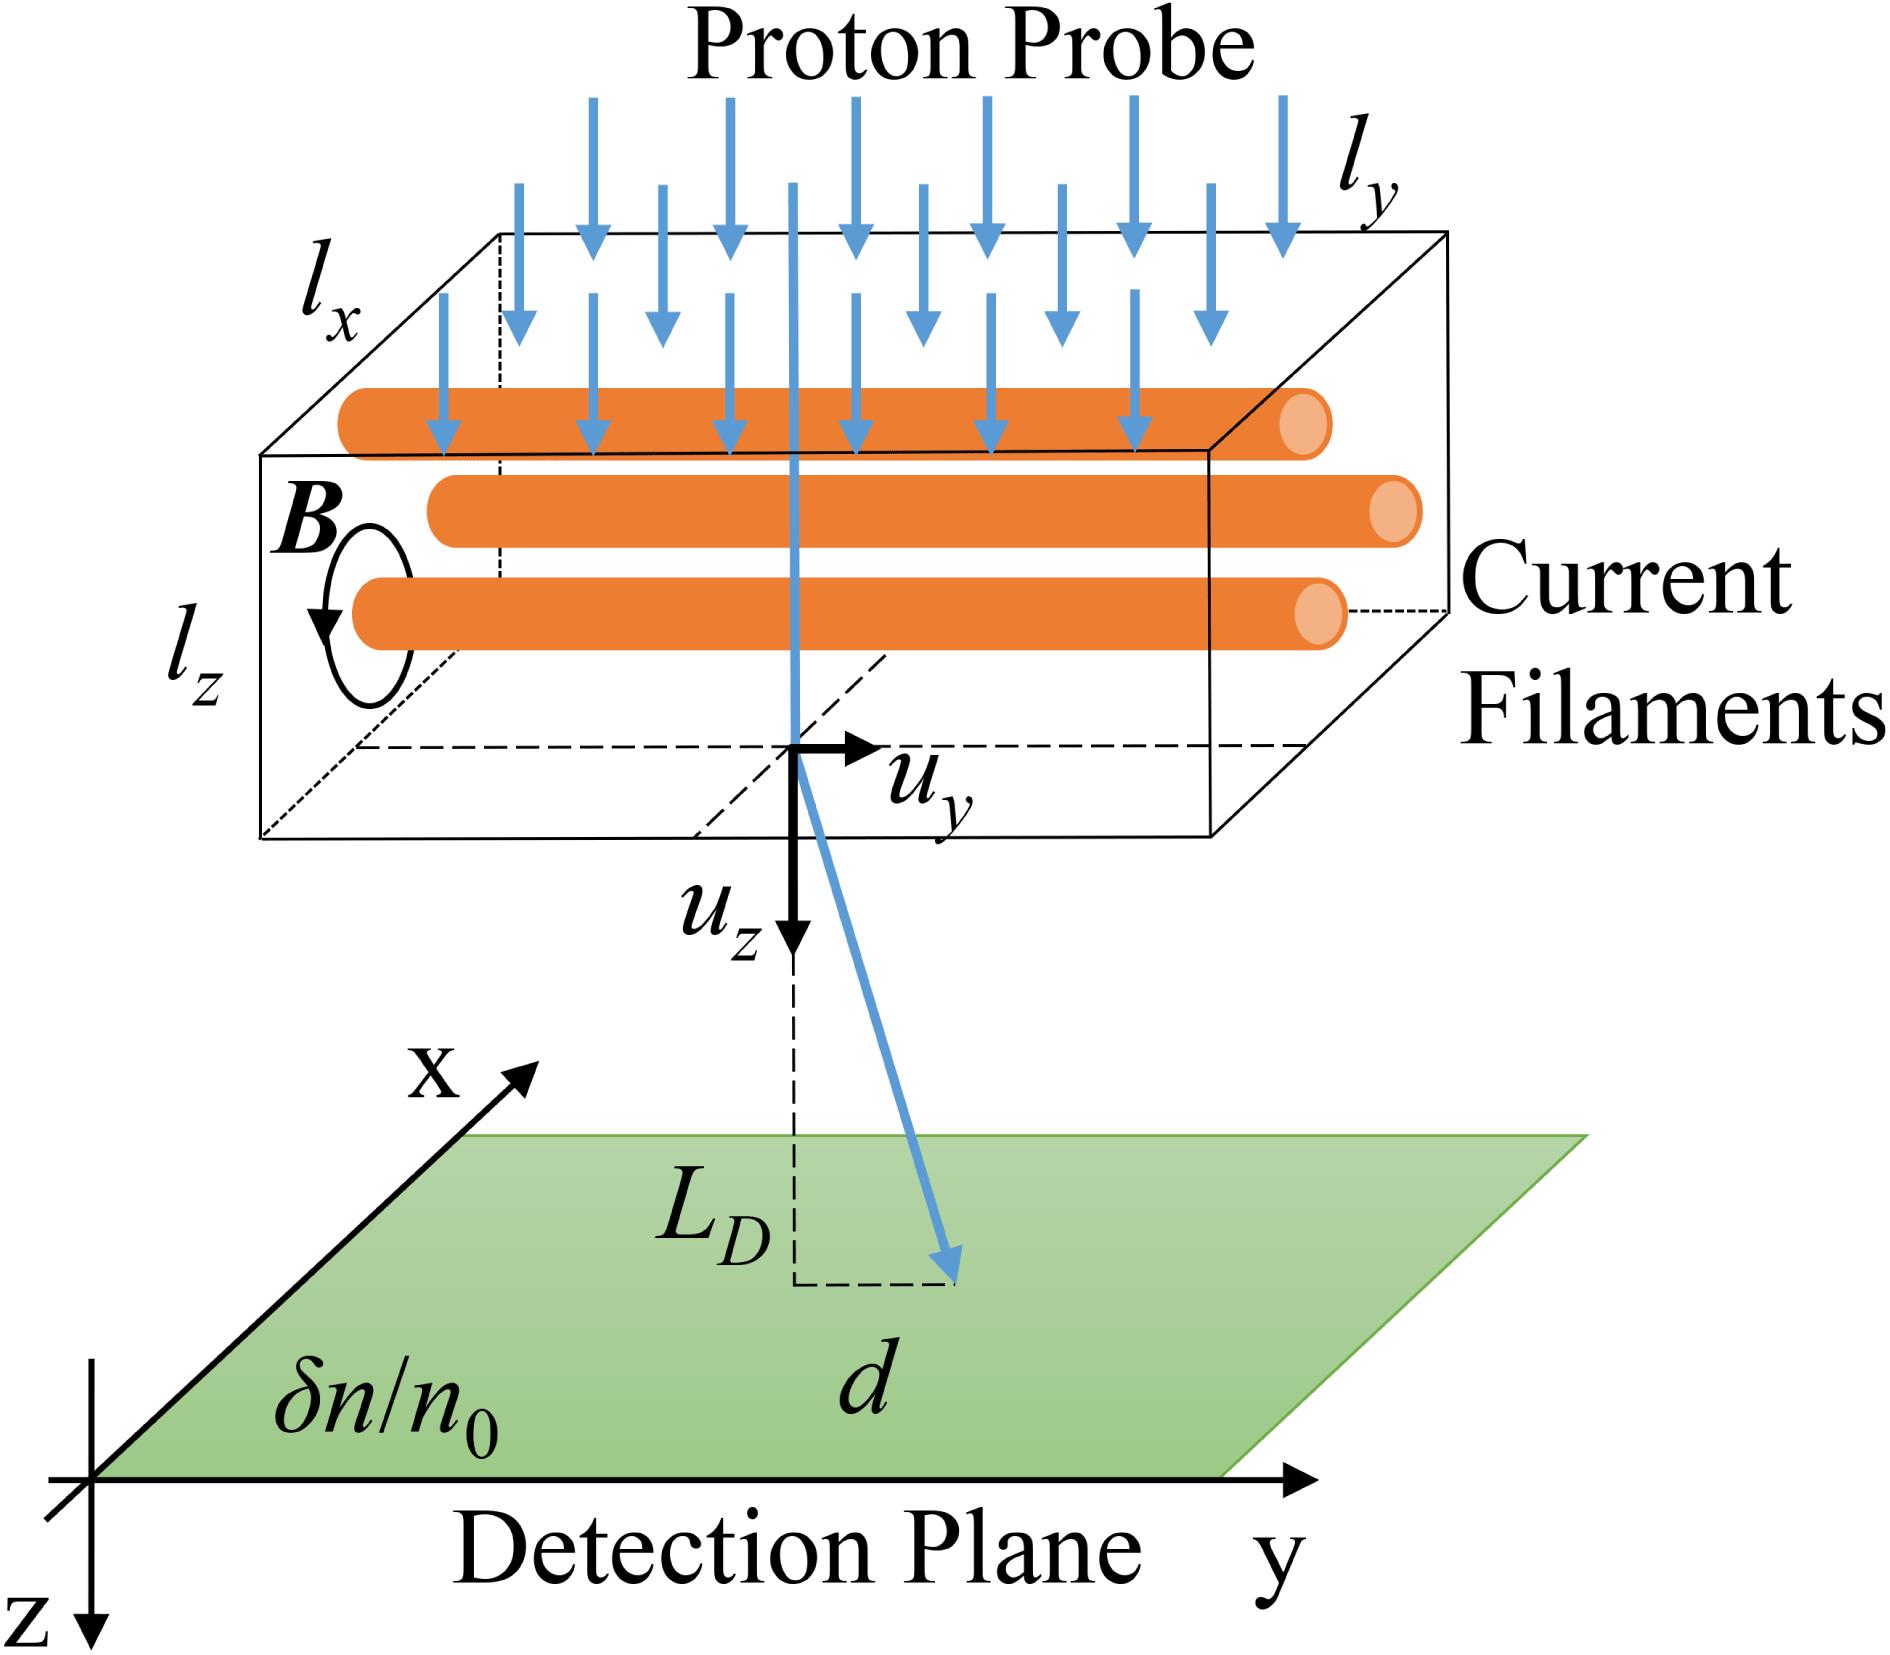
    Fig. 1. Schematic diagram of proton radiography of a two-dimensionally isotropic and stochastic magnetic field.
    (a) Transversal cross-section of the pre-set stochastic magnetic field tubes at $y=2~\text{mm}$. (b) Two-dimensional spectrum of the magnetic field by taking Fourier transforms of the field in (a), which shows an isotropic feature.
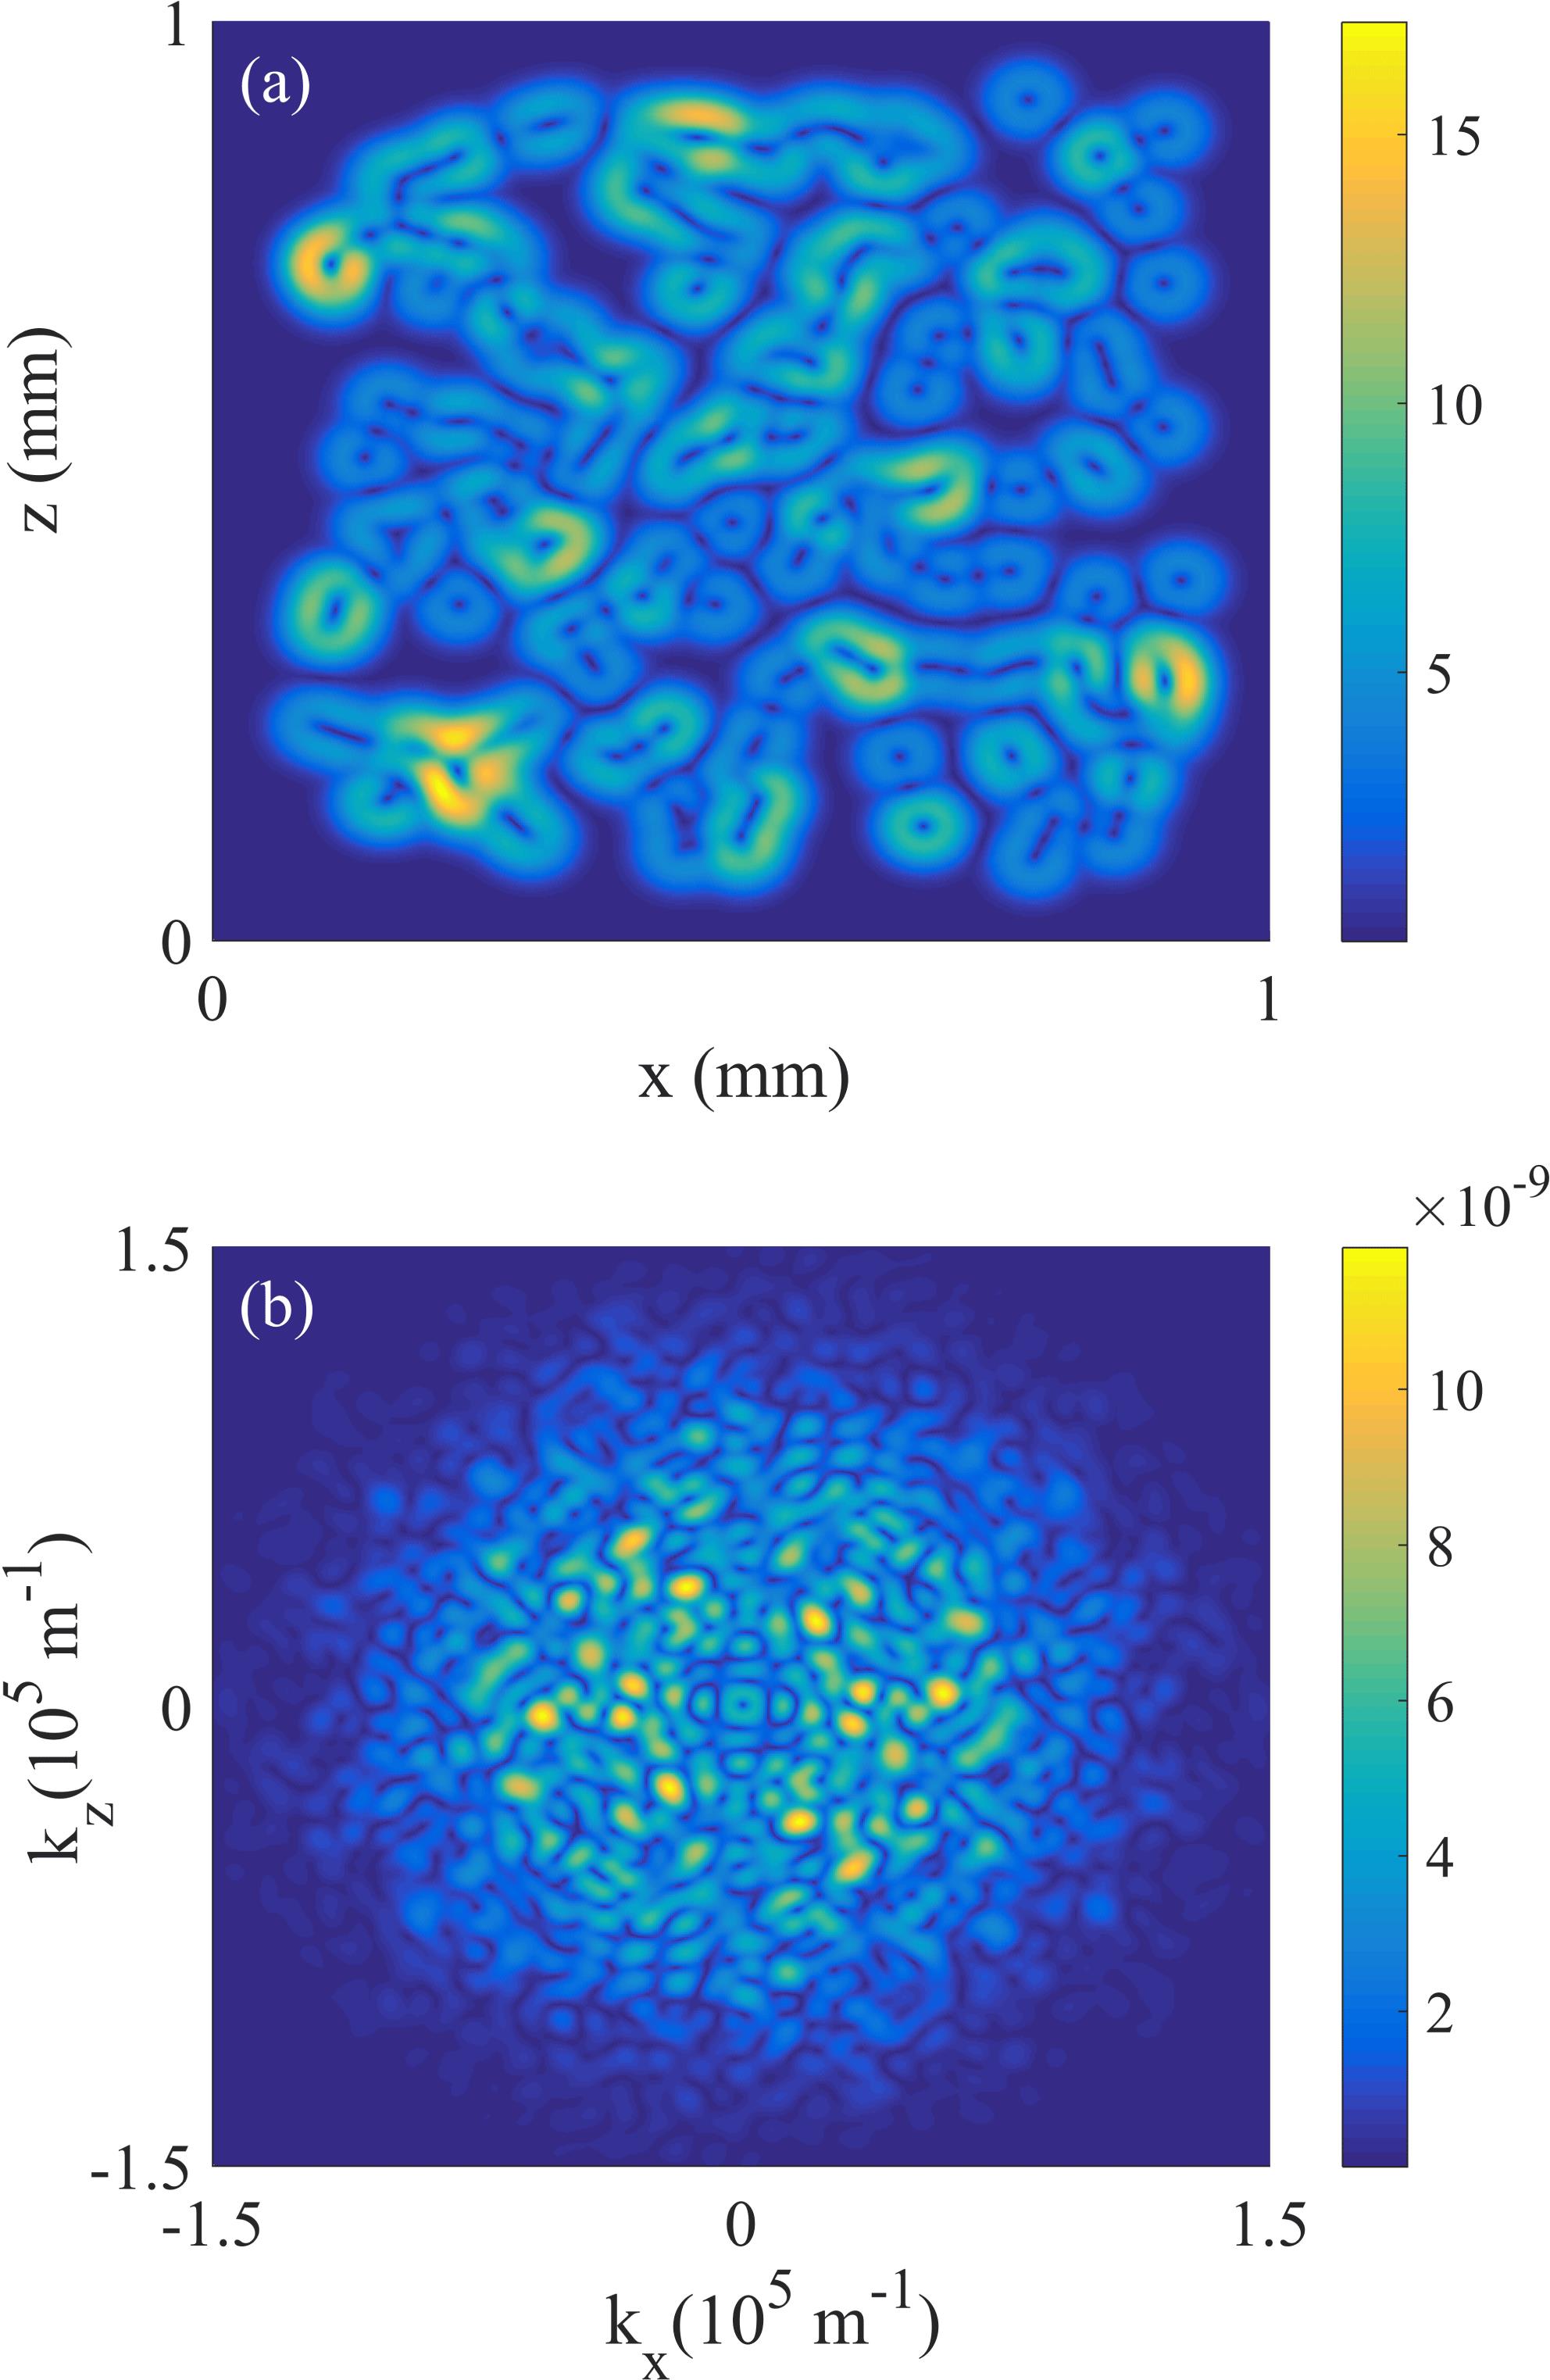
    Fig. 2. (a) Transversal cross-section of the pre-set stochastic magnetic field tubes at $y=2~\text{mm}$. (b) Two-dimensional spectrum of the magnetic field by taking Fourier transforms of the field in (a), which shows an isotropic feature.
    One-dimensional energy spectrum of the magnetic field $E_{B}(k)$. The red line corresponds to the energy spectrum obtained by taking Fourier transforms of the pre-set magnetic field in Figure 2(a), whereas the blue line corresponds to the energy spectrum extracted from proton radiography with Equation (22).
    Fig. 3. One-dimensional energy spectrum of the magnetic field $E_{B}(k)$. The red line corresponds to the energy spectrum obtained by taking Fourier transforms of the pre-set magnetic field in Figure 2(a), whereas the blue line corresponds to the energy spectrum extracted from proton radiography with Equation (22).
    (a) Proton density perturbation $\unicode[STIX]{x1D6FF}n/n_{0}$ on the detection plane when $L_{D}=5~\text{cm}$. (b) The extracted two-dimensional distribution of $u_{y}$. (c) One-dimensional distributions of $u_{y}$ at $y=2~\text{mm}$ from the extracted results and the pre-settings.
    Fig. 4. (a) Proton density perturbation $\unicode[STIX]{x1D6FF}n/n_{0}$ on the detection plane when $L_{D}=5~\text{cm}$. (b) The extracted two-dimensional distribution of $u_{y}$. (c) One-dimensional distributions of $u_{y}$ at $y=2~\text{mm}$ from the extracted results and the pre-settings.
    Bao Du, Hong-Bo Cai, Wen-Shuai Zhang, Shi-Yang Zou, Jing Chen, Shao-Ping Zhu. A demonstration of extracting the strength and wavelength of the magnetic field generated by the Weibel instability from proton radiography[J]. High Power Laser Science and Engineering, 2019, 7(3): 03000e40
    Download Citation