• Chinese Optics Letters
  • Vol. 16, Issue 4, 040604 (2018)
Aadil Raza1, Kangping Zhong2、*, Salman Ghafoor3、**, Saeed Iqbal1, Muhammad Adeel2, Shahid Habib1, Muhammad Fasih Uddin Butt1, and Chao Lu2
Author Affiliations
  • 1COMSATS Institute of Information Technology (CIIT), Islamabad, Pakistan
  • 2Department of Electronic and Information Engineering, The Hong Kong Polytechnic University, Hong Kong, China
  • 3National University of Sciences and Technology (NUST), Islamabad, Pakistan
  • show less
    DOI: 10.3788/COL201816.040604 Cite this Article Set citation alerts
    Aadil Raza, Kangping Zhong, Salman Ghafoor, Saeed Iqbal, Muhammad Adeel, Shahid Habib, Muhammad Fasih Uddin Butt, Chao Lu. SER estimation method for 56 GBaud PAM-4 transmission system[J]. Chinese Optics Letters, 2018, 16(4): 040604 Copy Citation Text show less
    Simulation setup of 56 GBaud PAM-4 transmission system.
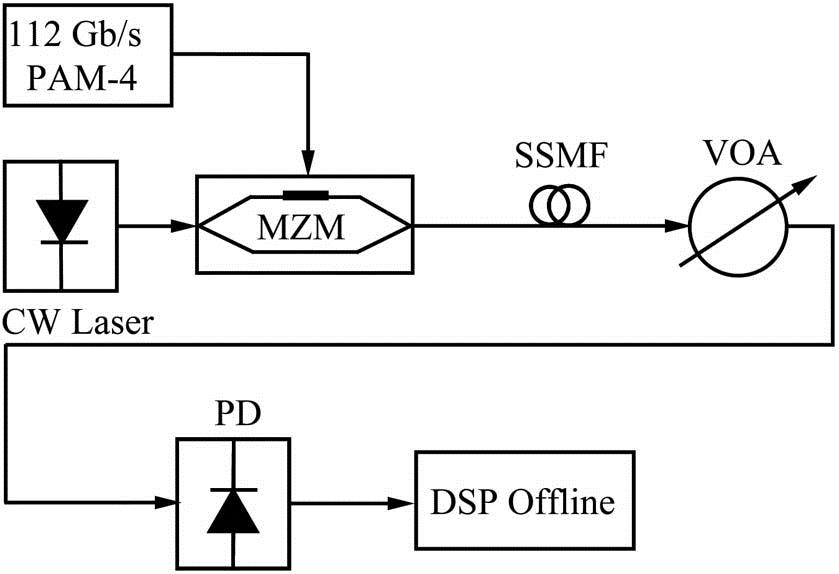
    Fig. 1. Simulation setup of 56 GBaud PAM-4 transmission system.
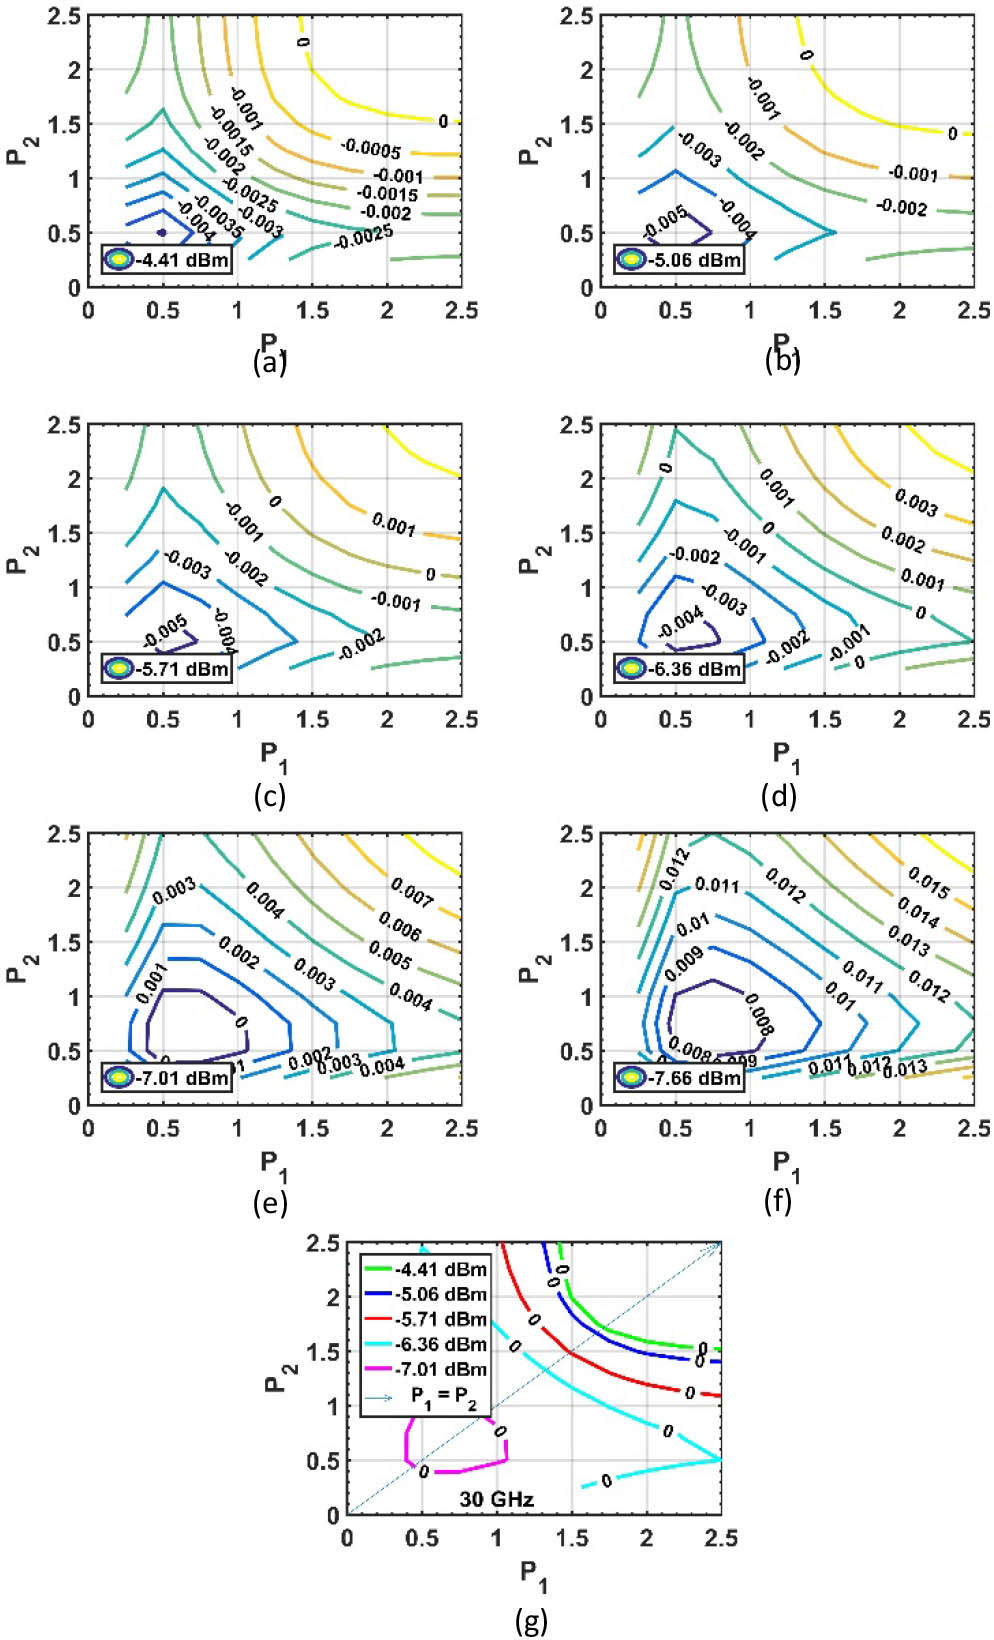
    Contour plots at (a) −4.41 dBm, (b) −5.06 dBm, (c) −5.71 dBm, (d) −6.36 dBm, (e) −7.01 dBm, and (f) −7.66 dBm for 30 GHz. (g) Contour lines at Z = 0 for different ROPs at 30 GHz.
    Fig. 2. Contour plots at (a) 4.41dBm, (b) 5.06dBm, (c) 5.71dBm, (d) 6.36dBm, (e) 7.01dBm, and (f) 7.66dBm for 30 GHz. (g) Contour lines at Z=0 for different ROPs at 30 GHz.
    Contour lines at Z = 0 for different ROPs at (a) 18 GHz, (b) 19 GHz, (c) 20 GHz, and (d) 25 GHz.
    Fig. 3. Contour lines at Z=0 for different ROPs at (a) 18 GHz, (b) 19 GHz, (c) 20 GHz, and (d) 25 GHz.
    (a) SER versus ROPs at different bandwidths. (b) Contour plot at −5.71 dBm for 18, 19, 20, 25, and 30 GHz. (c) P versus ROPs for 18, 19, 20, 25, and 30 GHz. (d) P versus receiver bandwidths at −4.41, −5.06, −5.71, −6.36, and −7.01 dBm.(e) Comparison among SERC, SERQ, and SERGGD as a function of ROPs at 30 GHz. (f) SER verus P for 18, 19, 20, 25, and 30 GHz at 10 km.
    Fig. 4. (a) SER versus ROPs at different bandwidths. (b) Contour plot at 5.71dBm for 18, 19, 20, 25, and 30 GHz. (c) P versus ROPs for 18, 19, 20, 25, and 30 GHz. (d) P versus receiver bandwidths at 4.41, 5.06, 5.71, 6.36, and 7.01dBm.(e) Comparison among SERC, SERQ, and SERGGD as a function of ROPs at 30 GHz. (f) SER verus P for 18, 19, 20, 25, and 30 GHz at 10 km.
    (a) Eye-diagram and (b) probability distribution function of the received signal of PAM-4 at −7.66 dBm at 30 GHz.
    Fig. 5. (a) Eye-diagram and (b) probability distribution function of the received signal of PAM-4 at 7.66dBm at 30 GHz.
    Experimental setup of 56 Gbaud PAM-4 transmission system.
    Fig. 6. Experimental setup of 56 Gbaud PAM-4 transmission system.
    Contour lines at Z = 0 for −4, −5, −6, −7. (a) BtB. (b) 10 km. (c) SER versus ROPs for BtB and 10 km. (d) P versus ROPs at BtB and 10 km. (e) SER versus P at BtB and 10 km.
    Fig. 7. Contour lines at Z=0 for 4, 5, 6, 7. (a) BtB. (b) 10 km. (c) SER versus ROPs for BtB and 10 km. (d) P versus ROPs at BtB and 10 km. (e) SER versus P at BtB and 10 km.
    (a) Eye-diagram and (b) probability distribution function of the received signal of PAM-4 at −7 dBm at 10 km.
    Fig. 8. (a) Eye-diagram and (b) probability distribution function of the received signal of PAM-4 at 7dBm at 10 km.
    ParameterValues
    Length (km)10
    Wavelength (nm)1310
    Linewidth (MHz)5
    Rx. BW (GHz)18,19,20,25, and 30
    Power (dBm)0
    PD thermal noise (pA/Hz0.5)20
    PD dark current (nA)10
    PD responsivity (A/W)1
    Table 1. Simulation Parameters
    Aadil Raza, Kangping Zhong, Salman Ghafoor, Saeed Iqbal, Muhammad Adeel, Shahid Habib, Muhammad Fasih Uddin Butt, Chao Lu. SER estimation method for 56 GBaud PAM-4 transmission system[J]. Chinese Optics Letters, 2018, 16(4): 040604
    Download Citation