1Key Laboratory of Photo-Electronic Materials, Ningbo University, Ningbo 315211, China
2State Key Laboratory on Integrated Optoelectronics, College of Electronic Science and Engineering and College of Physics, Jilin University, Changchun 130012, China
3Department of Physics, Dalian Maritime University, Dalian 116026, China
Yb3+/Er3+ co-doped Na5Lu9F32 single crystals used as a spectral up-converter to improve the power conversion efficiency of perovskite solar cells are prepared via an improved Bridgman approach. Green and red up-conversion (UC) emissions under the excitation of near-infrared (NIR) bands of 900–1000 nm and 1400–1600 nm can be observed. The effectiveness of the prepared materials as a spectral converter is verified by the enhancement of power conversion efficiency of perovskite solar cells. The sample with a UC layer is 15.5% more efficient in converting sunlight to electricity compared to the UC layer-free sample due to the absorption of sunlight in the NIR range. The results suggest the synthesized Yb3+/Er3+ co-doped Na5Lu9F32 single crystals are suitable for enhancing the performance of perovskite solar cells.
Solar cells have attracted intense research interest due to their capability to convert sunlight to electricity, providing a promising route to obtain clean and renewable energy for human beings[1–6]. In addition to traditional silicon solar cells, many single-junction solar cells such as organic photovoltatic (OPV) and perovskite solar cells (PSCs), have been developed for practical applications[7,8]. Recently, PSCs have attracted considerable attention for their simple fabrication, low cost, and high power conversion efficiency[9–16]. Photoelectric conversion efficiency of PSCs has been continuously refreshed from 3.8% in 2009 to more than 20% from recent reports[17]. However, the efficiency is still not comparable to the Shockley–Queisser limit, which can reach a maximum theoretical value of 30%, if the so-called spectral mismatch between the solar spectrum and the band gap of PSCs is overcome[18]. The inability of PSCs to absorb the photons of the near-infrared (NIR) region at 800–1700 nm in the solar spectrum is mainly responsible for the low energy conversion efficiency of the cells. The approach using a luminescent up-converter to combine lower energy photons and produce one higher energy photon within the absorption range of the PSC is a favorable way to resolve the problem[19–26].
Among many up-conversion (UC) materials, the single crystal provides higher transmission for light and thermal stability as well as good chemical durability. Recently, a , single crystal with efficient UC luminescence was synthesized in our laboratory[27]. The crystal has low maximum phonon energy (), and the optimum UC external quantum efficiency (QE) was about 6.80% under light excitation[28]. The value is higher than the QE from co-doped single crystals with 5.72% under light excitation[24]. Thus, we expect that the co-doped single crystal is a promising candidate to improve the performance of PSCs by converting NIR light to visible (VIS) light.
In this work, we have successfully synthesized highly transparent , single crystals and applied them to hybrid PSCs to improve the power conversion efficiency. The co-doping of and leads to relatively efficient VIS red and green emissions under the excitation of two NIR bands (900–1000 nm and 1400–1600 nm). The efficiency of the PSCs is improved 15.5% with the presence of the prepared materials as the UC layer, indicating the effectiveness of the , single crystals for UC applications.
Sign up for Chinese Optics Letters TOC. Get the latest issue of Chinese Optics Letters delivered right to you!Sign up now
co-doped single crystals were grown by an improved Bridgman method. The raw materials were commercially available powders with high purity NaF (99.99%), (99.99%), (99.99%), and (99.99%). The molar compositions of the raw materials were (). The detailed process of the improved Bridgman method was reported elsewhere[27,29]. The obtained single crystals were cut into pieces and well-polished to about 2.0 mm thickness for optical measurements.
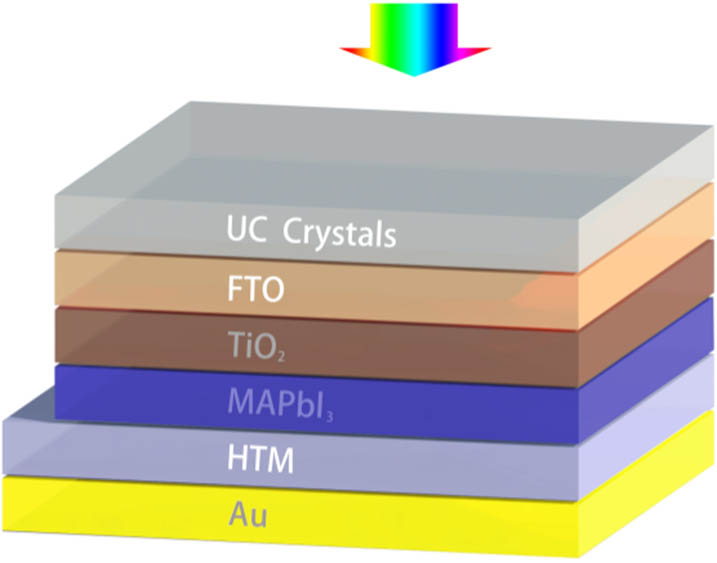
The dense electron transport layer was deposited onto substrates using the radio frequency magnetron sputtering (RFMS) method, where the FTO is etched with 30% HCl and zinc powder from the anodic contact area. The film was prepared via the thermal evaporation process, and the film was deposited on the dense layer of to form . The resulting film was immersed in CH3NH3I (MAI) solution with isopropanol and reacted to form . The hole transport material (HTM) was deposited by spin-coating a solution of spiro-oMeTAD at 2000 r/min for 35 s in nitrogen atmosphere. An Au electrode with a thickness 100 nm was deposited on the top of HTM via thermal evaporation. In order to utilize the NIR solar radiation sufficiently, we placed the UC single crystals close to the FTO of the PSC in the path of the incident light. The simulated sunlight was used as the light source to radiate the UC crystals. The assembled model is shown in Fig. 1.
The crystal structure was investigated by an XD-98X diffractometer (XD-3, Beijing). The absorption spectra and transmittance spectra were measured with a Cary 5000 UV/VIS/NIR spectrophotometer. The emission spectra were obtained with an FLSP920 type spectrometer (Edinburgh Co., England). All of the measurements were conducted at room temperature in the atmospheric condition.
Non-masked devices were tested under a Class A solar simulator (ABET Sun 2000) at AM1.5 and illumination conditions calibrated with a reference silicon cell (RERA Solutions RR-1002), using a Keithley 2400 as a source meter in ambient conditions without sealing for density–voltage (J–V) measurements with 1500 V points from to .
Figure 2(a) presents the measured X-ray diffraction (XRD) pattern of the 0.5% co-doped single crystal. A clear consistency can be found between the measured pattern and the standard Joint Committee on Powder Diffraction Standards (JCPDS) card (27-0725), indicating a pure phase is obtained from the prepared sample. The introduction of and ions does not induce significant change of the crystal structure. The and ions are expected to substitute the sites due to their similar valence and ionic radius. The lattice parameters of the obtained sample S1 is (space group Fm3m) from the measured XRD patterns. Pires and Davolos reported that the radius difference between the substitution sites and the dopants should be less than 30%, which can be estimated by the following expression[30]: where is the coordination number, is the radius difference percentage, and and are the ionic radii for the dopant and substitution site, respectively. The calculated between and is , while the between and is . Both values are within the allowed range of 30%, suggesting the dopants can effectively enter the sites without altering the crystal structure.
Figure 2.XRD patterns of co-doped single crystal. Insert is the photo of polished co-doped single crystal.
The absorption spectrum in the range of 400–2000 nm for the 1% co-doped single crystal sample is shown in Fig. 3(a). Two intense absorption bands centered at 980 and 1514 nm can be observed from the spectrum, corresponding to the transition from the ground state to the state of ions and the transition of of ions. Meanwhile, narrow absorption peaks at 485, 517, 646, and 794 nm in the VIS range can also be observed, which can be ascribed to the transitions of to , , , and of ions, respectively. Figure 3(b) illustrates the transmittance spectrum of the prepared single crystal; the maximum transmittance reaches 89% in the VIS region, indicating that the VIS light can penetrate the single crystal without significant absorption loss when the single crystal is used as the UC layer.
Figure 3.(a) VIS-NIR absorption spectrum of co-doped single crystals. (b) Transmittance spectrum of co-doped single crystal.
Figure 4(a) shows the UC spectra of co-doped crystals in the wavelength range from 400 to 750 nm under the excitation of a 980 nm laser diode with . Three characteristic emission peaks centered at 522, 551, and 669 nm can clearly be observed from Fig. 4(a), corresponding to the , , and transitions of ions, respectively. The green emission experiences a significant reduction when the concentration increases from 0.5% to 1%. Meanwhile, the red emission is slightly enhanced for the high concentration sample.
Figure 4.(a) VIS UC emission spectra of the , single crystal under 980 nm laser excitation. (b) Energy transfer mechanism for , under 980 nm excitation.
The energy level diagram is shown in Fig. 4(b) to illustrate the UC energy transfer (ET) mechanism in the , single crystal. The ion with one excited state is an ideal sensitizer for ions due to the resonant transitions of and . Under the 980 nm pumping light, the ions are promoted to the state, from which energy can be transferred to the ions to populate the state. The ions on the state can further be promoted to the state by absorbing another portion of energy from the ions. Ions on the state undergo a series of non-radiative relaxations to the , , and states. Green and red emissions can be observed when energies are transferred from these excited states to the ground state.
Figure 5(a) presents the UC spectra of the prepared samples under 1514 nm excitation. Similar to the 980 nm excited emission spectra, intense green and red emissions can also be obtained when 1514 nm is chosen to pump the samples. The intensity for the green and red emissions is significantly enhanced with the concentration increasing from 0.5% to 1%, which is different from the change of emission intensity in Fig. 4(a). In addition, a weak emission peak at 414 nm emerged in the 1% -doped UC spectra, corresponding to the transition. An energy diagram is also provided in Fig. 5(b), as an attempt to illustrate the UC mechanism under 1514 nm excitation. Ions on the ground state are firstly excited to the state through ground state absorption (GSA), which are further promoted to the , , , and states through the excited state absorption (ESA), generating blue (), green (, ), and red emissions () at 414, 528, 549, and 657 nm, respectively. Additionally, ET processes from to also exist to contribute UC luminescence. ESA and ET processes simultaneously enhance the UC emission when the prepared samples are used for the UC layer to improve the performance of PSCs[31,32].
Figure 5.(a) VIS UC emission spectra of the , single crystal under 1514 nm laser excitation. (b) Energy transfer mechanism of , under 1514 nm excitation.
Figure 6 illustrates the photoluminescence excitation (PLE) spectrum and NIR photoluminescence (PL) spectrum of single crystal, the spectral distribution of sunlight at AM 1.5 G, and the spectral response of the PSC to show the potential application of the prepared material. But, current cells only utilize a relatively small fraction of the solar photons. Evidently, the absorption of the PSC is most efficient from 300 to 800 nm, which suggests 55%–60% of the sunlight cannot be utilized by the PSC as the solar spectral distribution from 800 to 1700 nm is well beyond the effective response range of the PSC. The co-doped single crystal can effectively convert sunlight in the NIR range to the PSC sensitive range. Hence, the prepared material is promising for enhancing the performance of PSCs.
Figure 6.PLE spectrum (blue) and PL spectrum (gray) of co-doped single crystals. AM 1.5 G solar spectrum (red) and spectral response of PSC (green) are the backgrounds.
co-doped single crystals are placed on top of PSC under the irradiation of simulated solar illumination with an intensity of to verify the potential application of the prepared samples. Figure 7 shows photocurrent J–V characteristics of the PSCs with the presence of co-doped single crystals as UC layers. It can be observed that the short-circuit current density () is enhanced from for the plain PSC sample to 22.92 and when , and , are used as UC layers, respectively. The efficiency of the PSCs is also improved from 14.69% for the sample without the UC layer to 16.96% and 16.97% for samples with the contribution from the prepared UC materials (see Table 1). An approximate 15.5% enhancement of efficiency is obtained, which verifies the effectiveness of the prepared materials as the UC layer. Detailed photovoltaic parameters are listed in Table 1.
Devices
Jsc(mA·cm−2)
Voc (V)
Fill Factor (FF)
η (%)
Increase (%)
Reference PCE (no crystal)
21.29
1.02
67.63
14.69
–
Na5Lu9F32:1%Er3+, 8%Yb3+
22.92
1.03
71.84
16.96
15.45
Na5Lu9F32:0.5%Er3+, 8%Yb3+
23.58
1.03
70.32
16.97
15.50
Table 1. Photovoltaic Parameters of the Prepared Perovskite Solar Cells
In summary, co-doped single crystals have been grown by an improved Bridgman method. Green and red UC emissions can be obtained under the excitation of both 980 and 1514 nm. The effectiveness of the prepared materials is tested by combining with PSCs. The PSC with an up-converting layer exhibits the maximal power conversion efficiency of 16.97% with an enhancement of 15.5% compared with the reference PSC under the simulated sunlight irradiation. This work provides new possibilities to enhance the power conversion efficiency of PSCs by using single crystals as UC layers.