• Journal of Geographical Sciences
  • Vol. 30, Issue 11, 1761 (2020)
Haitao MA1、2、* and Zhan SUN1、2
Author Affiliations
  • 1Key Laboratory of Regional Sustainable Development Modeling, Institute of Geographic Sciences and Natural Resources Research, CAS, Beijing 100101, China
  • 2College of Resources and Environment, University of Chinese Academy of Sciences, Beijing 100049, China
  • show less
    DOI: 10.1007/s11442-020-1811-y Cite this Article
    Haitao MA, Zhan SUN. Comprehensive urbanization level and its dynamic factors for five Central Asian countries[J]. Journal of Geographical Sciences, 2020, 30(11): 1761 Copy Citation Text show less
    Locations of the five Central Asian countries
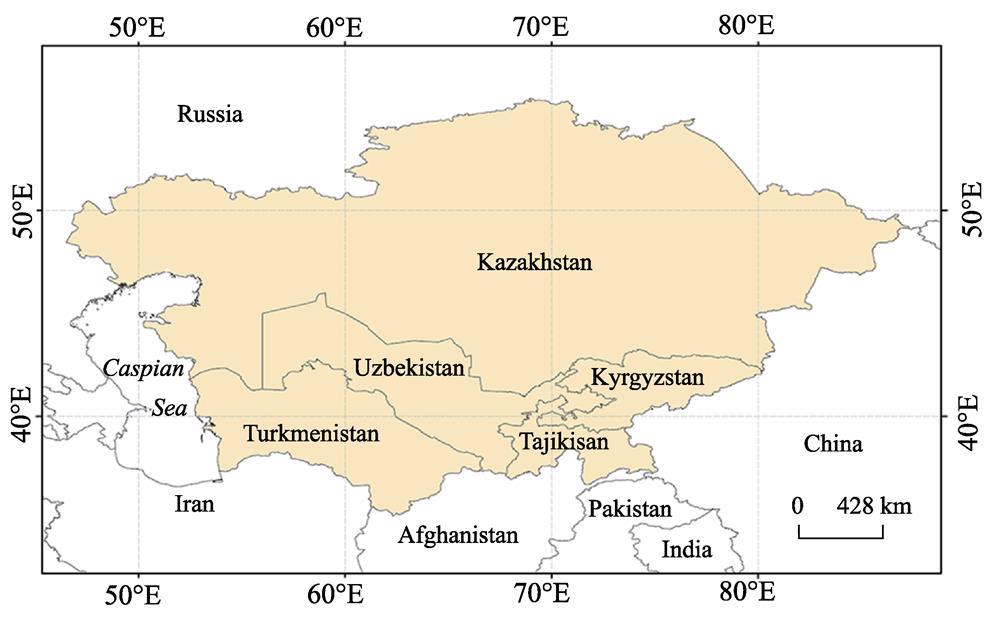
    Fig. 1. Locations of the five Central Asian countries
    Evolution of the comprehensive urbanization level of the five Central Asian countries during 1991-2017
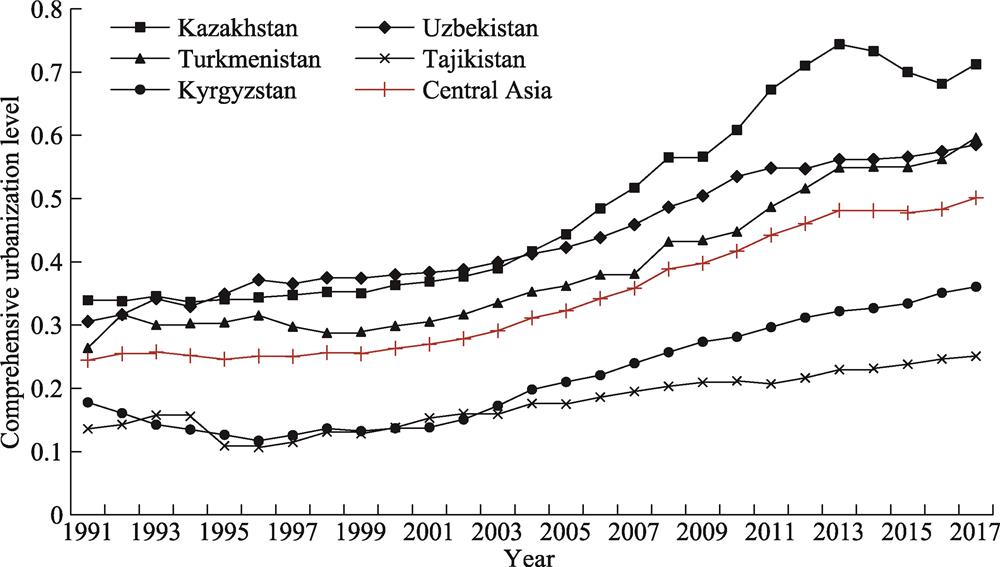
    Fig. 2. Evolution of the comprehensive urbanization level of the five Central Asian countries during 1991-2017
    Spatial distribution of the comprehensive urbanization level of the five Central Asian countries
    Fig. 3. Spatial distribution of the comprehensive urbanization level of the five Central Asian countries
    Evolution of four urbanization subsystems of the five Central Asian countries during 1991-2017
    Fig. 4. Evolution of four urbanization subsystems of the five Central Asian countries during 1991-2017
    Urbanization dynamic mechanism of Central Asian countries based on internal and external forces
    Fig. 5. Urbanization dynamic mechanism of Central Asian countries based on internal and external forces
    Independence timeCountry area(×104 km2)Total population(×104 persons)Urbanizationrate (%)Population density (persons/km2)GDP(×108 USD)Per capita GDP (USD/person)
    Kazakhstan1991-12272.491827.6557.436.771705.399331.05
    Uzbekistan1991-0844.743295.5450.4877.47505.001532.37
    Turkmenistan1992-0148.81585.0951.5912.45407.616966.64
    Tajikistan1991-0914.14910.0825.2365.5775.23826.62
    Kyrgyzstan1991-0820.00631.5839.1032.9380.931281.36
    Central Asia-400.177249.9448.1618.472774.163826.45
    Table 1.

    Main economic and social indicators of the five Central Asian countries in 2018

    Target layerSubsystemWeightEvaluation indicatorsUnitWeight
    Comprehensive urbanization levelDemographic urbanization0.278Urban population proportion%0.091
    Urban population growth rate%0.070
    Non-agricultural employment proportion%0.117
    Economic urbanization0.284Per capita GDPUSD/person0.095
    Per capita industrial output valueUSD/person0.089
    Non-agricultural output ratio%0.100
    Social urbanization0.216Per capita medical expenditureUSD/person0.090
    Per capita public education spendingUSD/person0.061
    Internet coverage rate%0.065
    Spatial urbanization0.222Land urbanization rate%0.085
    Urban built-up areakm20.051
    Urban road network densitykm/km20.086
    Table 2.

    Comprehensive urbanization evaluation index system of the five Central Asian countries

    TypesDynamic indicator (abbreviation)UnitExplanation
    Internal dynamicsUrban per capita income (UPI)USD per personUrban income pulls
    Per capita agricultural output (PAO)USD per personRural income thrust
    Government final consumption (GFC)10,000 USDGovernment administrative motivation
    Total market capitalization (TMC)10,000 USDMarket economy motivation
    External dynamicsActually utilized foreign capital (AFC)10,000 USDExternal investment motivation
    Total merchandise trade (TMT)10,000 USDExternal trade motivation
    Bidirectional dynamicsRailway construction length (RCL)kmExternal transportation facilities motivation
    Railway freight volume (RFV)10,000 tonne × kmInternal and external logistics connection
    Table 3.

    Explanatory variables of urbanization dynamics in the five Central Asian countries

    Test methodItemsT-statisticP-value
    Kao testModified Dickey-Fuller-2.76500.0028
    Dickey-Fuller-2.10390.0077
    Augmented Dickey-Fuller-2.61770.0045
    Unadjusted modified Dickey-Fuller-2.67680.0037
    Unadjusted Dickey-Fuller-2.07640.0189
    Pedroni testModified Phillips-Perron1.83990.0329
    Phillips-Perron-2.31750.0102
    Augmented Dickey-Fuller-2.06850.0193
    Table 4.

    Data cointegration test results

    Test methodAssumptionF-statisticP-valueTest result
    F testHybrid model88.540.0000Fixed-effect model
    Hausman testRandom-effects model230.350.0000Fixed-effect model
    Table 5.

    Test results of model assumptions

    TypesVariableCoefficientT-statisticP-value
    Internal dynamicUrban per capita income (UPI)0.28135.180.000
    Per capita agricultural output (PAO)-0.2218-7.430.000
    Government final consumption (GFC)0.23484.300.000
    Total market capitalization (TMC)0.06122.450.016
    External dynamicActually utilized foreign capital (AFC)0.08062.110.017
    Total merchandise trade (TMT)0.09372.270.007
    Bidirectional dynamicRailway construction length (RCL)0.56654.940.000
    Railway freight volume (RFV)0.08872.880.005
    -Constant term-13.64932-15.890.000
    Table 6.

    Coefficient estimation results of the fixed-effect model

    F-statisticR2-withinR2-betweenR2-overallP-value (F)
    207.250.92180.83860.73650.0000
    Table 7.

    Overall estimation of the fixed-effect model

    Haitao MA, Zhan SUN. Comprehensive urbanization level and its dynamic factors for five Central Asian countries[J]. Journal of Geographical Sciences, 2020, 30(11): 1761
    Download Citation