
Yichun Li, Kaiheng Xiao, Zhongtian Li, Chang Liu, Yanhao Yu, Zhennan Tian. Femtosecond Laser Direct Writing of Bent Waveguides with High Curvature and Low Loss[J]. Chinese Journal of Lasers, 2024, 51(16): 1602403
- Chinese Journal of Lasers
- Vol. 51, Issue 16, 1602403 (2024)
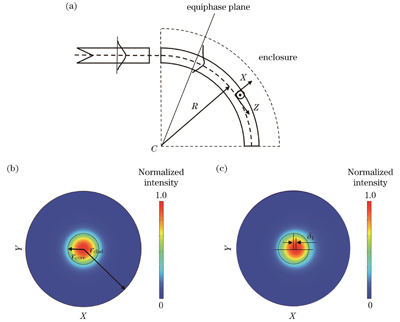
Fig. 1. Top view and simulated mode field distribution of straight waveguide and circular-arc bent waveguide. (a) Top view of straight waveguide and circular-arc bent waveguide; (b) simulated mode field distribution of straight waveguide; (c) simulated mode field distribution of circular-arc bent waveguide
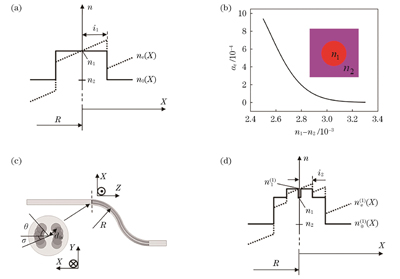
Fig. 2. Schematic diagram of refractive index distribution of bent waveguides before and after conformal transformation, influence of n1-n2 on
Fig. 3. Simulation results of S-shaped bent waveguide. (a),(b) Cross-sectional refractive index distribution and bending loss simulation diagrams of bent waveguide without modification lines; (c),(d) cross-sectional refractive index distribution and bending loss simulation diagrams of bent waveguide with modification lines; (e) relationship between bending loss and curvature radius of bent waveguides with and without modification lines
Fig. 4. Optical microscope photos and mode field distribution pictures. (a1),(b1) Cross-sectional optical microscope photos of bent waveguide before and after adding modification line, respectively; (a2),(b2) mode field distribution pictures corresponding to (a1) and (b1), respectively; (a3),(b3) simulated mode field distribution images of bent waveguide before and after adding modification line, respectively
Fig. 5. Different schemes of writing order of waveguide and modification lines and their corresponding bending losses. (a) Schematic diagram of writing order of waveguide and modification lines; (b) bending losses of waveguides under different writing schemes
Fig. 6. Bending losses of waveguides under different
Fig. 7. Bending losses of waveguide under different
Fig. 8. Bending losses of waveguide under different writing methods of modification lines,

Set citation alerts for the article
Please enter your email address
© Copyright 2018-2021 | Chinese Laser Press. All Rights Reserved 沪ICP备15018463号-20