• Chinese Journal of Lasers
  • Vol. 45, Issue 5, 510009 (2018)
Meng Xiangqian1、2、3、*, Pan Xin1、2、3, Liu Xingtao1、2、3, Wang Xiufen1、2、3, Zhuang Quanfeng1、2、3, Li Hui1、2、3, Chen Chao1、2、3, Li Xianxin1、2、3, and Wang Zhangjun1、2、3
Author Affiliations
  • 1[in Chinese]
  • 2[in Chinese]
  • 3[in Chinese]
  • show less
    DOI: 10.3788/CJL201845.0510009 Cite this Article Set citation alerts
    Meng Xiangqian, Pan Xin, Liu Xingtao, Wang Xiufen, Zhuang Quanfeng, Li Hui, Chen Chao, Li Xianxin, Wang Zhangjun. Design and Experimental Verification of Polar Nephelometer Based on Imaging[J]. Chinese Journal of Lasers, 2018, 45(5): 510009 Copy Citation Text show less
    Design of polar nephelometer based on imaging
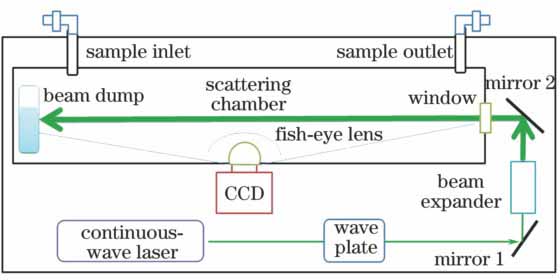
    Fig. 1. Design of polar nephelometer based on imaging
    Images captured by CCD at (a) grade 2, (b) grade 4, (c) grade 6, (d) grade 8, (e) grade 10, (f) grade 12,(g) grade 14, (h) grade 16, (i) grade 18, (j) grade 20, (k) grade 22 and (l) grade 24 light intensity of integrating sphere
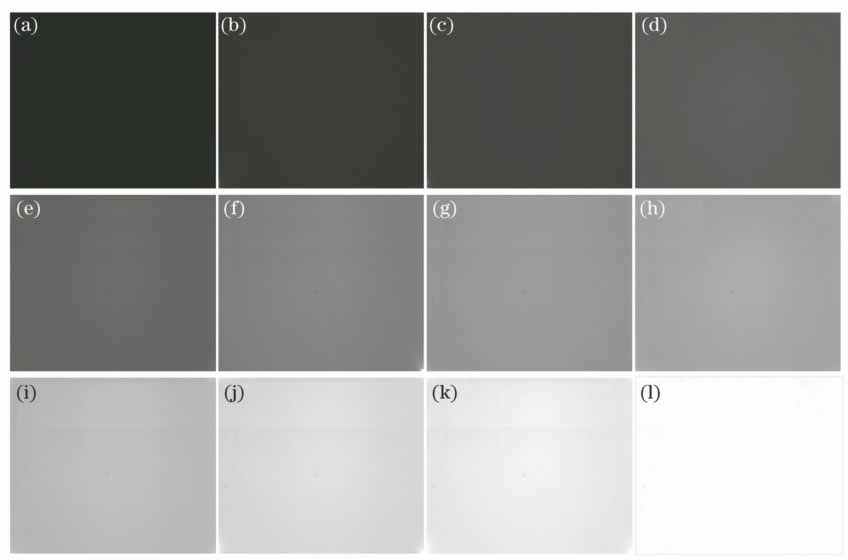
    Fig. 2. Images captured by CCD at (a) grade 2, (b) grade 4, (c) grade 6, (d) grade 8, (e) grade 10, (f) grade 12,(g) grade 14, (h) grade 16, (i) grade 18, (j) grade 20, (k) grade 22 and (l) grade 24 light intensity of integrating sphere
    (a) Linear fitting curves between light intensity grade and grey scale of center point in the scatting image;(b) linear fitting curves between light intensity grade and grey level of scattering beam region
    Fig. 3. (a) Linear fitting curves between light intensity grade and grey scale of center point in the scatting image;(b) linear fitting curves between light intensity grade and grey level of scattering beam region
    Imaging of beam (dotted line) with a CCD
    Fig. 4. Imaging of beam (dotted line) with a CCD
    Relationship between pixel position and the scale of standard ruler
    Fig. 5. Relationship between pixel position and the scale of standard ruler
    Relationship curve between pixel width and the scale of standard ruler
    Fig. 6. Relationship curve between pixel width and the scale of standard ruler
    Fitting relationship between pixel position and scattering angle
    Fig. 7. Fitting relationship between pixel position and scattering angle
    Comparison between experimental nitrogen scattering phase function and Rayleigh scattering phase function
    Fig. 8. Comparison between experimental nitrogen scattering phase function and Rayleigh scattering phase function
    Variation of scattering grey level with polarization angle at different scattering angles
    Fig. 9. Variation of scattering grey level with polarization angle at different scattering angles
    Linear fitting of measured grey level with the corresponding polarization angle sine squared value at scattering angle of 90°
    Fig. 10. Linear fitting of measured grey level with the corresponding polarization angle sine squared value at scattering angle of 90°
    Variation of scattering intensity with polarization angle at scattering angle of 90°
    Fig. 11. Variation of scattering intensity with polarization angle at scattering angle of 90°
    Comparison between measured values in water vapor scattering and scattering phase function calculated by Mie theory
    Fig. 12. Comparison between measured values in water vapor scattering and scattering phase function calculated by Mie theory
    ParameterValue
    Resolution /[(°)·step-1]0.00125
    Maximum speed /[(°)·s-1)]25
    Positioning accuracy /(°)<0.005
    Radial jump /μm<20
    Horizontal jump /μm<20
    Table 1. Parameters of the electrical mirror mount
    InterceptSlopeStatistics
    ValueStandarderrorValueStandarderrorR2
    -183.902752.69432757.65351.135510.996231
    Table 2. Linear fitting parameters of the photoelectric conversion at scattering beam region
    Meng Xiangqian, Pan Xin, Liu Xingtao, Wang Xiufen, Zhuang Quanfeng, Li Hui, Chen Chao, Li Xianxin, Wang Zhangjun. Design and Experimental Verification of Polar Nephelometer Based on Imaging[J]. Chinese Journal of Lasers, 2018, 45(5): 510009
    Download Citation