


Cai-he Liu, Rui-peng Bai, Yu Bai, Yuan Guo, Zhen Zhang. Si(111) Electrode/Electrolyte Interfacial Studied by in-situ Second Harmonic Generation†[J]. Chinese Journal of Chemical Physics, 2020, 33(5): 554
- Chinese Journal of Chemical Physics
- Vol. 33, Issue 5, 554 (2020)
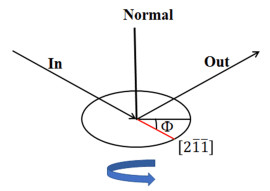
Fig. 1. Air/Si(111) interface rotation diagram
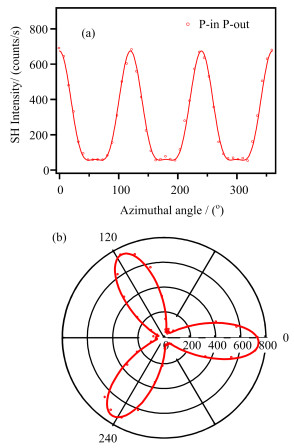
Fig. 2. (a) SHG response curve of air/Si(111) interface with the pp polarization combination. The circles in the figure represent experimental data points and the solid line represents the fitted curves. (b) Polar map of the air/Si(111) interface. The red circle represents the intensity of the SHG signal and the polar axis represents the angle
Fig. 3. (a) Cyclic voltammogram (CV) curve measured from the Si(111)/CH
Fig. 4. The potential-dependent SHG intensity of the Si(111)/CH
|
Table 1. Fitting results of potential dependent SHG response for different polarization combinations at $ \phi $ $ ^{\circ} $
|
Table 2. Fitting results of potential dependent SHG response for different polarization combinations at $\phi$=0$^{\circ}$. The relative phase $\theta$ cannot be obtained by Eq.(6), and the values are not shown in the table.
|
Table 3. Fitting results of potential dependent SHG response for different polarization combinations at $ \phi $ $ ^{\circ} $


Set citation alerts for the article
Please enter your email address

© Copyright 2018-2021 | Chinese Laser Press. All Rights Reserved 沪ICP备15018463号-20