
Jian Gu, Jiaojiao Ren, Dandan Zhang, Lijuan Li, "Extraction of optical constants in the terahertz band using material dispersion models," Chin. Opt. Lett. 20, 053001 (2022)
- Chinese Optics Letters
- Vol. 20, Issue 5, 053001 (2022)
Abstract
1. Introduction
In terahertz (THz) time-domain spectroscopy (TDS), ultrashort femtosecond laser pulses are used to excite a photoconductive antenna or nonlinear crystal to produce broadband THz radiation, with frequencies ranging from a few hundred gigahertz (GHz) to several THz. It is a safe, non-contact interferometric measurement method, which has been proven to be an effective way to measure a material’s optical constants. As the optical constants of a material are physical quantities that characterize its optical properties in bulk, accurate THz-TDS-derived optical constants can provide adequate physical and chemical information about the material and also serve as basic data for studies on the material’s interaction with THz waves. These optical constants also have important applications in the semiconductor[
The Fabry–Pérot (F-P) effect, which arises from the repeated reflections of THz waves in a sample, is the primary obstacle for the accurate acquisition of optical constants from optically thin samples via THz-TDS. Several methods to eliminate the F-P effect have been proposed to improve the reliability of THz-TDS-derived optical constants. Although the F-P effect can be eliminated by temporal windowing or by using a self-calibrating method[
If the material is optically thick, the dynamic range of the THz spectrum will be small, resulting in a low signal-to-noise ratio (SNR). In this case, it is difficult to accurately ascertain a material’s optical constants from its transmission spectrum using a frequency-domain method. Kramers–Kronig analysis[
Sign up for Chinese Optics Letters TOC. Get the latest issue of Chinese Optics Letters delivered right to you!Sign up now
To address the aforementioned issues, we propose a material dispersion model-based method for the simulation of time-domain THz signals, which can be used to obtain the optical constants of a material via the optimization of its fit to the measured THz signal. This method was used to obtain the optical constants of a 470-µm-thick monocrystalline silicon sample and a 16.35-mm-thick polycarbonate (PC) sample. The proposed method was successful in removing all of the F-P oscillations from the computed optical constants and in estimating optical constants in low-SNR spectral regions.
2. Methods
The proposed method uses the transfer matrix method (TMM) to compute the theoretical time-domain response of THz waves that have passed through a material. Here, the forward and backward propagations of THz waves in a material are described by a second-order matrix of Fresnel coefficients and a transfer matrix. The Fresnel coefficients matrix
In this equation,
As we will only consider the scenario where the THz wave is transmitted through the material, the backward (reflected) component of the electric field is assumed to be zero, that is,
Therefore, the theoretical time-domain response of the THz wave
The complex refractive index of the material can be estimated using a medium (material) dispersion model. The Debye model provides an adequate description of the dispersion characteristics of most semiconductor materials. Therefore, our method uses the first-order Debye model as its material dispersion model, which is shown in Eq. (6):
To accurately estimate the dispersion model parameters, we define the following error function:
3. Experimental Results and Discussion
A 1560 nm femtosecond laser with a repetition rate of 100 MHz was used to excite the photoconductive antenna and produce THz waves in a range of 0.02–2 THz. In the experiment, the time window is 320 ps, and the spectrum resolution is 3.125 GHz. The sample is placed in an atmospheric environment at a temperature of 22°C–24°C and a humidity of 32%–40%. To eliminate the influence of random noise on the signal, the average value of 100 signals was taken as the final measurement signal.
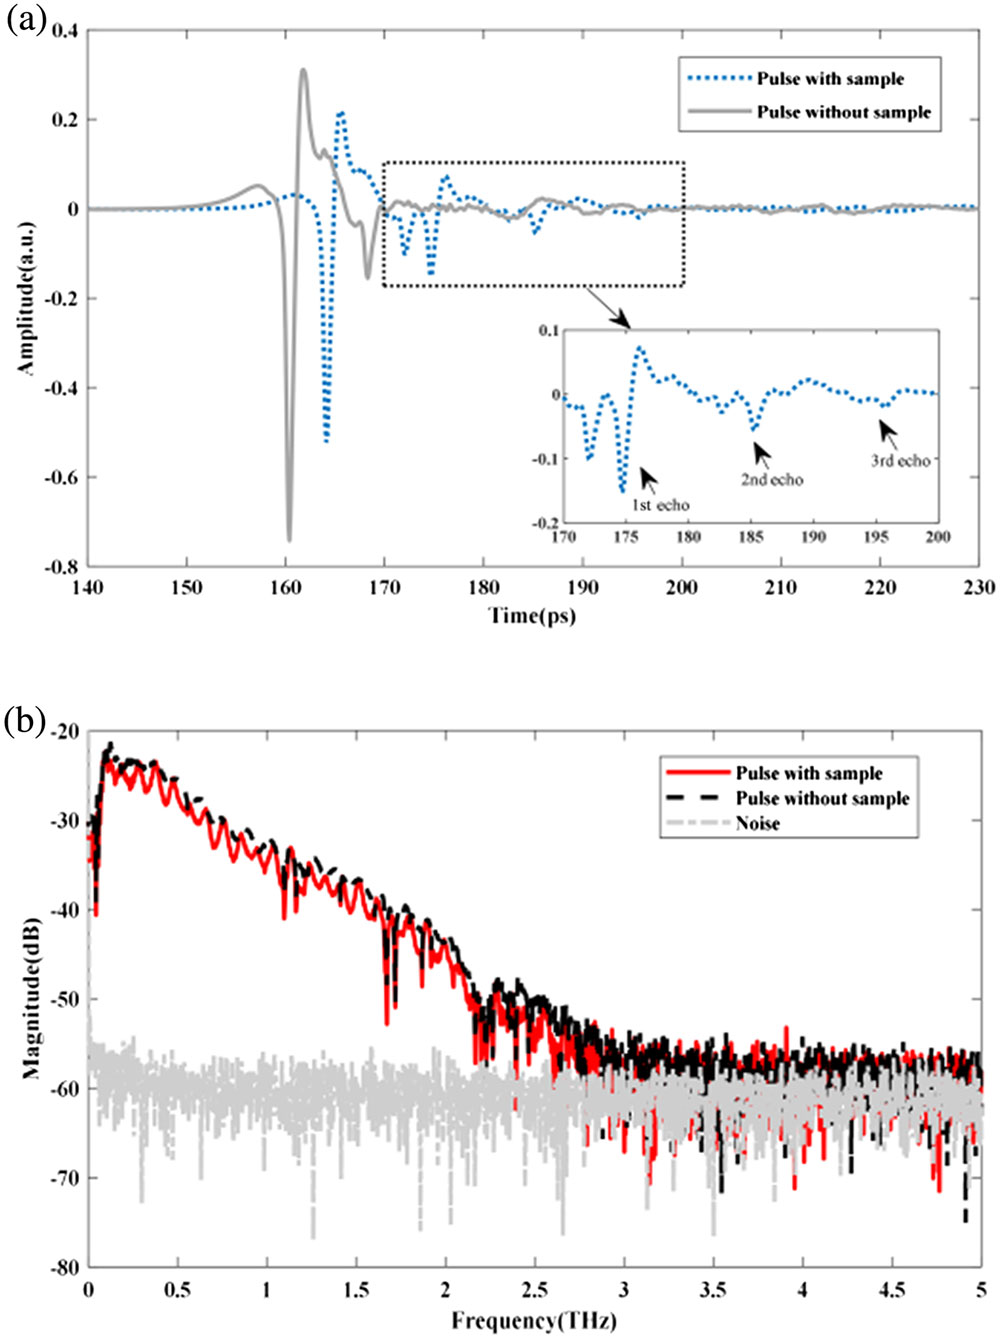
The proposed method was validated by extracting the optical constants of a 470-µm-thick monocrystalline Si sample, which is regarded as an optically thin sample. As the monocrystalline Si sample has a high refractive index and low absorption in the THz band, THz waves will be internally reflected multiple times inside this sample. Figure 1(a) shows the reference (sample-less) signal and Si sample signal that were collected via THz-TDS. Because of the F-P effect, the main pulse is followed by three echoes with progressively weakening amplitudes in the Si sample signal. The frequency-domain signals of the sample were obtained via a fast Fourier transform, as shown in Fig. 1(b). It is shown that the SNR of the frequency spectrum decreases with increasing frequency; it decreases to 1 at 3 THz. Furthermore, the frequency spectrum of the Si sample shows a significant amount of oscillation owing to the F-P effect.
![]()
Figure 1.Time- and frequency-domain THz signals of a 470-µm-thick monocrystalline Si sample. (a) Time-domain THz signal of the 470-µm-thick monocrystalline Si sample and the sample-less reference signal. The magnified inset shows the three echoes that were generated by the F-P effect. (b) Frequency spectra of the 470-µm-thick monocrystalline Si sample, reference signal, and noise in the THz band.
The optical constants of the Si sample were computed using an iterative frequency-domain method and our method, as shown in Fig. 2. As frequency-domain methods are strongly reliant on the frequency spectrum of the sample, the optical constants computed by the iterative frequency-domain method are superimposed with numerous fake oscillations. Alternatively, our method can eliminate the F-P effect as it does not depend on the sample’s frequency spectrum. An envelope mean filter (EMF) was used to filter the optical constants obtained by the frequency-domain method, and the filtered results were then compared to those of our method. It is shown that the refractive indices and extinction coefficients obtained from the results of our method and the filtered results are very similar, as they only differ by 0.0028 and 0.0004 in their refractive indices and extinction coefficients, respectively, at 1.25 THz.
![]()
Figure 2.Refractive indices and extinction coefficients of the Si sample. Comparison in terms of (a) refractive indices and (b) extinction coefficients.
The SNR is inevitably low at the high- and low-frequency extremes of the THz-TDS spectra. As the frequency-domain method is susceptible to noise, the optical constants calculated by this method are nonlinear in these frequency regions. The optical constants that were computed for the Si material in the 2–2.5 THz band are shown in Fig. 3. As shown, the constants computed by the frequency-domain and EMF methods are quite random, which implies that they are unreliable. Conversely, the results of our method maintain their trend throughout the 2–2.5 THz region and stay inside the envelope of the curve computed by the iterative method. Hence, our method can be used to estimate material optical constants even in spectral regions with low SNRs.
![]()
Figure 3.Refractive indices and extinction coefficients of the Si sample at 2–2.5 THz frequencies. Comparison in terms of (a) refractive indices and (b) extinction coefficients.
To confirm this conclusion, our method was used to extract the optical constants of 4.88- and 16.29-mm-thick PC samples. The transmission spectra of the two PC samples and the sample-less condition are shown in Fig. 4. The PC has much higher absorption than monocrystalline Si, and its absorption increases exponentially with increasing thickness, especially in the high-frequency region. The SNRs of the transmission spectra of the 4.88 and 16.29 mm PC samples fall to 1 at 1.5 and 0.7 THz, respectively, which indicates that the effective frequency range of the thicker sample is less than half that of the thinner sample.
![]()
Figure 4.THz transmission spectra of the two PC samples and the sample-less condition.
The refractive indices and extinction coefficients of the two PC samples were computed using our method and the iterative frequency-domain method, as shown in Fig. 5. The material thickness has no effect on the optical parameters of the material; therefore, the optical parameters of the two PC materials should be consistent. Owing to the reduction of the spectral SNR, the refractive index of the two different-thickness PC materials calculated by the frequency-domain iterative method is significantly different, and the effective spectral range is reduced from 1.4 to 0.7 THz. Beyond the effective spectrum range, the uncertainty of material optical parameters increases significantly. The extinction coefficient of the 4.88-mm-thick PC material calculated by this method is consistent with the iterative frequency-domain method at 0–0.5 THz. In the high-frequency region, the fitting accuracy of the Debye model decreases with an increase in frequency, and the maximum deviation at 1.4 THz is 0.005. For the optical parameters of the 16.38-mm-thick PC material at a frequency greater than 0.7 THz, the results are consistent with those of the 4.88-mm-thick PC material, which realizes the accurate estimation of optical parameters in the low-SNR spectrum region and expands the effective frequency range of the optical parameters.
![]()
Figure 5.Comparison between refractive indices and extinction coefficients computed by the proposed and iterative frequency-domain methods for two PC materials with different thicknesses. Comparison in terms of (a) refractive indices and (b) extinction coefficients.
4. Conclusion
This work proposes a time-domain fit optimization method to extract a material’s optical constants. In the proposed method, the Debye dispersion model is used to describe the material’s dispersion characteristics, while the TMM is used to construct a transfer function for the material. This enables the simulation of a THz pulse that passed through the material in the time domain. In addition, a new error function was defined, which uses the rms error and correlation coefficient between the simulated and measured signals to constrain the amplitude and phase errors of the simulated signal. The PSO algorithm was used to optimize the error function and reduce the probability of falling into local optima. The proposed method was successful in eliminating all of the F-P oscillations from the optical constants of a 0.47-mm-thick monocrystalline Si sample and estimating the optical constants of 4.88- and 16.29-mm-thick PC samples in their low-SNR regions. Hence, the proposed method can be used to accurately acquire the optical constants of optically thin and high absorption materials. However, it needs to apply an appropriate dispersion model to obtain accurate optical material parameters. Furthermore, we need to have a priori knowledge of the materials and know which dispersion model the materials can conform to, as the proposed method is not applicable to materials that cannot be described by a dispersion model. Nevertheless, the proposed method can be used to simulate the optical constants of numerous material types simply by using an appropriate material dispersion model. This has a certain application prospect for the optical parameter extraction of multilayer composites.
References
[1] D. R. Grischkowsky, S. Keiding, M. V. Exter, C. Fattinger. Far-infrared time-domain spectroscopy with terahertz beams of dielectrics and semiconductors. J. Opt. Soc. Am. B, 7, 2006(1990).
[2] M. V. Exter, D. Grischkowsky. Optical and electronic properties of doped silicon from 0.1 to 2 THz. Appl. Phys. Lett., 56, 1694(1990).
[3] K. M. Tych, A. D. Burnett, C. D. Wood, J. E. Cunningham, A. R. Pearson, A. G. Davies, E. H. Linfield. Applying broadband terahertz time-domain spectroscopy to the analysis of crystalline proteins: a dehydration study. J. Appl. Crystallogr., 44, 129(2010).
[4] J. Han. Probing negative refractive index of metamaterials by terahertz time-domain spectroscopy. Opt. Express, 16, 1354(2008).
[5] J. A. Hejase, E. J. Rothwell, P. Chahal. Self-calibrating technique for terahertz time-domain material parameter extraction. J Opt. Soc. Am. A, 28, 2561(2011).
[6] L. Duvillaret, F. Garet, J. L. Coutaz. A reliable method for extraction of material parameters in terahertz time-domain spectroscopy. IEEE J. Sel. Top. Quantum Electron., 2, 739(2002).
[7] K. Zaytsev, A. Gavdush, S. P. Lebedev, V. E. Karasik, S. O. Yurchenko. A method of studying spectral optical characteristics of a homogeneous medium by means of terahertz time-domain spectroscopy. Opt. Spectrosc, 118, 552(2015).
[8] K. M. Tych, C. D. Wood, W. Tych. A simple transfer-function-based approach for estimating material parameters from terahertz time-domain data. IEEE Photonics J., 6, 6800211(2014).
[9] M. Scheller. Data extraction from terahertz time domain spectroscopy measurements. J. Infrared Millim. Terahertz Waves, 35, 638(2014).
[10] I. Pupeza, R. Wilk, M. Koch. Highly accurate optical material parameter determination with THz time-domain spectroscopy. Opt. Express, 15, 4335(2007).
[11] W. Withayachumnankul, B. Ferguson, T. Rainsford, S. P. Mickan, D. Abbott. Material parameter extraction for terahertz time-domain spectroscopy using fixed-point iteration. Proc. SPIE, 5840, 221(2005).
[12] R. Fastampa, L. Pilozzi, M. Missori. Cancellation of Fabry–Perot interference effects in terahertz time-domain spectroscopy of optically thin samples. Phys. Rev. A, 95, 063831(2017).
[13] D. Liu, T. Lu, F. Qi. A reliable method for removing Fabry–Perot effect in material characterization with terahertz time-domain spectroscopy. IEEE Trans. Terahertz Sci. Technol., 10, 443(2020).
[14] M. Bernier, F. Garet, J. L. Coutaz, H. Minamide, A. Sato. Accurate characterization of resonant samples in the terahertz regime through a technique combining time-domain spectroscopy and Kramers–Kronig analysis. IEEE Trans. Terahertz Sci. Technol., 6, 442(2016).
[15] S. Huang, P. C. Ashworth, K. W. C. Kan, Y. Chen, V. P. Wallace, Y. Zhang, E. Pickwell-MacPherson. Improved sample characterization in terahertz reflection imaging and spectroscopy. Opt. Express, 17, 3848(2009).
[16] H. Hirori, K. Yamashita, M. Nagai, K. Tanaka. Attenuated total reflection spectroscopy in time domain using terahertz coherent pulses. Jpn. J. Appl. Phys., 43, L1287(2004).


Set citation alerts for the article
Please enter your email address

© Copyright 2018-2021 | Chinese Laser Press. All Rights Reserved 沪ICP备15018463号-20