
L. Guiramand, J. E. Nkeck, X. Ropagnol, T. Ozaki, F. Blanchard, "Near-optimal intense and powerful terahertz source by optical rectification in lithium niobate crystal," Photonics Res. 10, 340 (2022)
- Photonics Research
- Vol. 10, Issue 2, 340 (2022)
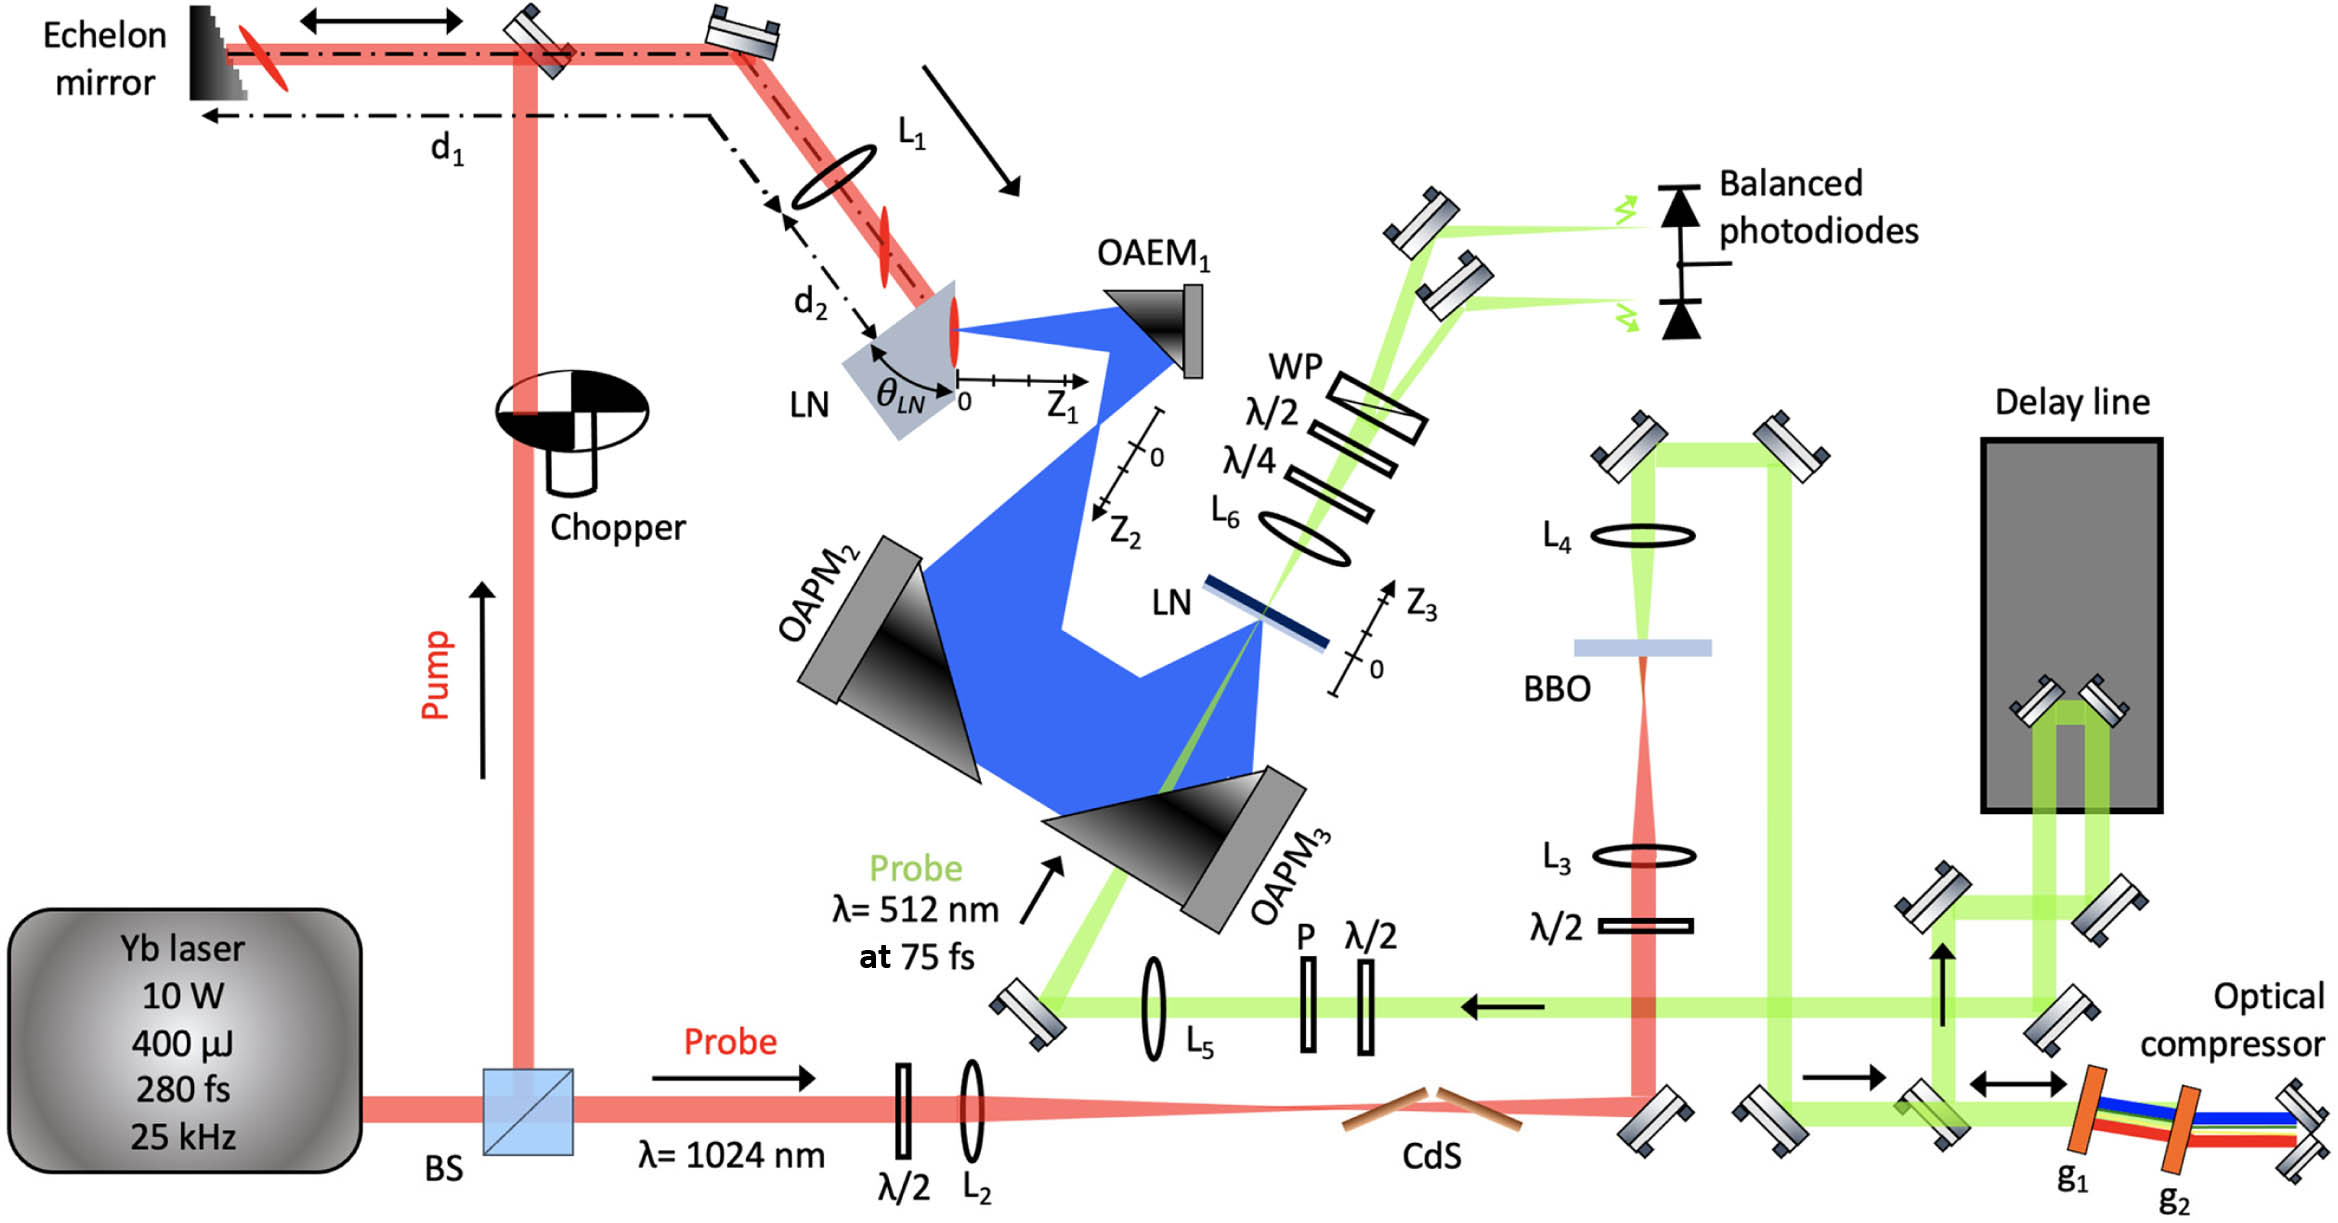
Fig. 1. Experimental setup for the generation and detection of THz pulses with the LN and their detection by EO sampling. BS, beam splitter; M 1 M 1 d 1 d 2 θ LN L 1 L 2 L 3 L 4 L 5 L 6 OAEM 1 OAPM 2 OAPM 3 g 1 g 2 λ / 2 λ / 4
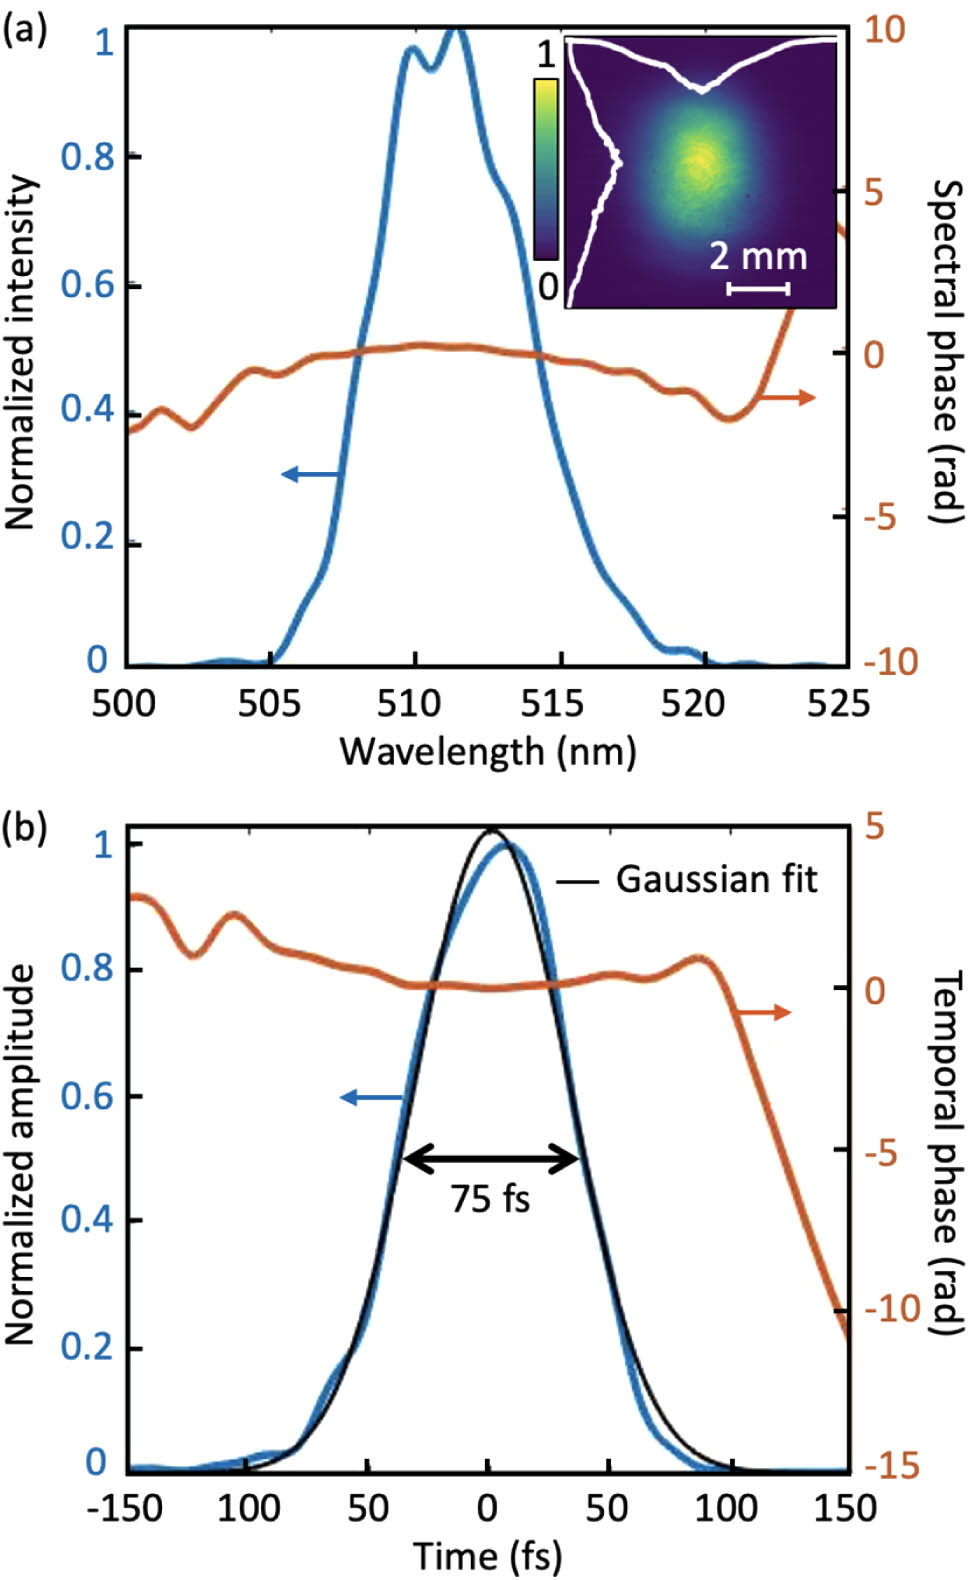
Fig. 2. Measured characteristics of the probe pulse after temporal compression. (a) Spectral amplitude and spectral phase distribution with the image of the probe spot in the inset; (b) temporal intensity and temporal phase distribution.
Fig. 3. Pump spot image. (a) 1 mm before the image plan position; (b) at the image plan position; and (c) 1 mm after the image plan position; (d) horizontal profile of the pump spot at the focus position; (e) normalized pump spectra at the entrance and the exit of the LN crystal after OR process.
Fig. 4. THz beam radius at several locations along its propagation path (a) at the LN crystal exit facet; (b) along the focus of the OAEM; (c) along the focus of the third off-axis mirror, which corresponds to the positions Z 1 Z 2 Z 3 1 , respectively.
Fig. 5. (a) Temporal evolution of the generated THz pulse detected by EO sampling in an unpurged environment, with the zoom view of the temporal evolution of the THz pulse in a purged environment in the inset; (b) normalized spectrum of the generated THz pulse in an unpurged environment, with the normalized spectrum at logarithmic scale in the inset.
Fig. 6. Normalized THz transmission through the InGaAs sample as a function of z OAPM 3 OAPM 4 OAPM 5
| |||||||||||||||||||||||||||||||||||||||||||||||||||||||||||||||||||||||||||||||||||||||||
Table 1. Summary of the Performances of Some of the Recent LN Sources Based on a TPFP Configurationa


Set citation alerts for the article
Please enter your email address

© Copyright 2018-2021 | Chinese Laser Press. All Rights Reserved 沪ICP备15018463号-20