Francesco Falcetelli, Filippo Bastianini, Pawel Bocheński, Leonardo Rossi, Raffaella Di Sante, Gabriele Bolognini. Optical characterization of strain sensing cables for Brillouin optical time domain analysis[J]. Journal of the European Optical Society-Rapid Publications, 2022, 18(1): 2022007
Copy Citation Text
Two innovative optical fiber cable layouts designed to improve strain measurement accuracy for Brillouin Optical Time Domain Analysis (BOTDA) sensors through improved strain transfer efficiency are presented and discussed. Swept Wavelength Interferometry (SWI) is used to experimentally evaluate their performance alongside analytical models and numerical simulation through Finite Element Method (FEM). The results show good agreement between the different methods and show that the second sensing cable design presents good features to minimize the mismatch between measured and actual strain. Finally, the strain response of both strain and temperature sensing cables of this design are evaluated, showing that their difference in response is reliable enough to allow temperature compensation.Two innovative optical fiber cable layouts designed to improve strain measurement accuracy for Brillouin Optical Time Domain Analysis (BOTDA) sensors through improved strain transfer efficiency are presented and discussed. Swept Wavelength Interferometry (SWI) is used to experimentally evaluate their performance alongside analytical models and numerical simulation through Finite Element Method (FEM). The results show good agreement between the different methods and show that the second sensing cable design presents good features to minimize the mismatch between measured and actual strain. Finally, the strain response of both strain and temperature sensing cables of this design are evaluated, showing that their difference in response is reliable enough to allow temperature compensation.
Optical fiber sensors represent one of the most interesting technologies for many structural health monitoring applications [1, 2]. Compared to their electronic counterparts, optical fiber sensors are lightweight, small size (which makes them suitable to be embedded in composites, 3D printed structures and other materials [3, 4]), immune to electromagnetic interference and capable of transmitting a large amount of information [5–10]. Among the various distributed sensing techniques, Brillouin Optical Time Domain Analysis (BOTDA) gained significant relevance amid the scientific and industrial community. BOTDA is based on the Stimulated Brillouin Scattering (SBS) phenomenon and allows to monitor large structures by extracting temperature and strain profiles along tens of kilometers of sensing fiber, with spatial resolutions of the order of few centimeters [11–13]. While a great deal of study focuses on the interrogating system, an important factor for BOTDA sensors performance is the structure on the sensing cable. In many applications, the exposure to harsh environmental conditions may compromise the fiber functionality and requires the sensing fiber to be protected by additional layers. However, each protective layer further increases the mismatch between the strain at the core (the measured strain) and the strain in the outer cable sheath (the true strain) [14]. The modelling and minimization of this mismatch, known as strain transfer, is an essential aspect of sensing cable design and has a significant impact on overall strain sensing performance.
In addition, for simultaneous temperature and strain sensing, it is necessary to employ both strain sensing cables, which are bonded to the structure under test, and temperature sensing ones, which are installed in a loose configuration. Because of this, minimizing the transfer of strain from the structure to the temperature sensing cable is another important aspect for sensing performance.
In this study, an experimental setup based on Swept Wavelength Interferometry (SWI) distributed strain sensing technique is illustrated, calibrated, and used alongside analytical and numerical simulations, to accurately evaluate the strain affecting sensing cables built from two new designs intended for BOTDA, and is compared to the strain perceived by the host structure in order to evaluate their strain transfer efficiency. Afterwards, SWI is used to evaluate one of the designs in term of residual strain detected by the temperature sensing cable.
2 Sensing cable design
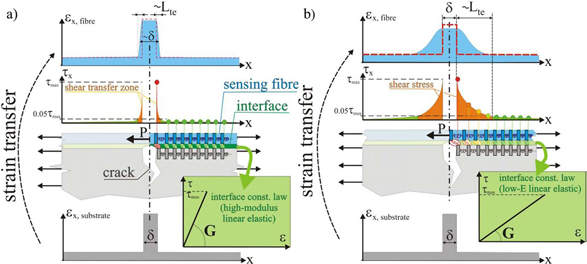
In general, the strain transfer process of sensing cables can be envisioned as a transfer function linking the strain applied to the structure (input) to the strain applied to the fiber core (output), and key parameters for the optimization of strain transfer mechanisms are the shear moduli of the sensing cable layers and their reciprocal mechanical coupling. To illustrate this, Figure 1 shows the strain response of two sensing cables due to a crack in the substrate where they are surface bonded. The first one (Fig. 1a) has a relatively stiff sheath, while the second one (Fig. 1b) has a much softer one. Theoretically, the crack in the substrate can be considered to cause an infinitesimal length displacement of , which is equivalent to a Dirac delta function in terms of strain. In general, a crack with a finite length displacement can be generalized as a rectangular strain profile.
Figure 1.Strain transfer models of a crack causing an infinitesimal displacement for a high (a) and a low (b) shear modulus sensing fiber.
In both cases, due to the system transfer function, the perturbated strain region in the fiber core is larger than the original δ crack opening on the substrate. Referring to Figure 1 it is possible to define a strain transfer length Lte, as the region where the strain perturbation propagates into the fiber core. Therefore, the perturbated area in the fiber core is equal to δ + 2Lte. While δ does not depend on the sensing cable, Lte is related to the system transfer function and is larger for softer cables and smaller for stiffer cables. Ideally, an infinitely stiff cable with a perfect mechanical coupling within its layer has a constant transfer function equal to 1 and simply replicates the strain present in the substrate. This configuration would result in a “perfect” strain transfer with a spatial resolution which is only limited by the interrogator performance. Although lowering Lte might in principle be desirable, the features of the sensing scheme must also be taken into consideration. For instance, an extremely efficient strain transfer is typically desired for conventional point-like strain sensors such as electrical strain gauges, but for sensors such as BOTDA, which have a relatively low spatial resolution (>10 cm), strain discontinuities (i.e. cracks) distributed over lengths much shorter than that would not be reliably reconstructed. In addition, deformation spikes above the fiber tolerance limit would lead to irreparable damage. Because of this, unlike other sensing applications, BOTDA requires strain sensing cables that smooth strain peaks in the fiber core over a length comparable to the spatial resolution of the sensor. This can be achieved by employing less stiff cable jackets with a lower shear modulus such as the one in Figure 1b, or by producing a sensing cable whose layers can slip if a certain strain threshold is exceeded. Therefore, sensing cable design needs to be specifically tailored to the sensing application it is designed for.
The two cable designs developed in this study are shown in Figure 2. The first sensing cable design was developed with the following goals as standard: (i) optimized mechanical coupling with the structure; (ii) protection against harsh environmental conditions; (iii) stable attenuation and sensitivity over the range of operational conditions; (iv) capability of withstanding large deformations; (v) absence of creep and other long-term phenomena capable of degrading the measuring performance of the cable. During preliminary testing, the performance of this design raised several concerns in terms of fiber uniformity, decoupling of the temperature compensation fiber and overall mechanical coupling between the strain sensing fiber and the observed structure. The second design, compared to the first one, was introduced as a way to address these issues with the following changes: (i) lower speed ramp-up during fabrication to ensure better uniformity of the fiber pre-stress; (ii) the presence of a silane-based lubricant to reduce the drag on the temperature compensation fiber; (iii) different cable jacket material to avoid slippage with the inner fiber tubing; (iv) structured surface to improve the mechanical coupling with the host structure. These changes are expected to improve overall sensing performance in terms of strain sensing accuracy, better distinction with temperature readings, and more reliable strain transfer.
3.1 Numerical model and theoretical background on SWI
First, the performance of the devices was evaluated through numerical simulations based on the development of a Finite Element Method (FEM) model of the two cables using Abaqus/CAE. Every single layer of the cables was modeled, and their shapes was accurately reproduced based on direct microscope observations. The contact region between the surfaces of every layer was modeled applying a tie constraint, implying a perfect bonding within the parts. The cables behavior under different loads was simulated by imposing fixed displacements in the substrate structure (see Fig. 3), thus reproducing real experimental conditions.
Figure 3.Numerical model. Highlighted region represents the fixed displacement imposed to simulate the applied load; (a) first cable, (b) second cable.
Afterwards, the strain transfer of the two cables was experimentally assessed using an Optical Backscatter Reflectometer (OBR) based on Swept-Wavelength Interferometry (SWI) [15–17]. SWI involves measuring the Rayleigh backscattered signal generated by refractive index variations in silica fibers. For each point of the fiber, the strain value can be derived from the reflected wavelength λR by treating each elementary segment of the fiber as a Fiber Bragg Grating sensor. While the change in refractive index is generally non-periodical, it is possible to define a local average perturbation period ΛAVG dependent on λR and the effective refractive index neff through the relation:λ
By detecting the Rayleigh backscattered light before the experiment, it is possible to determine a stable baseline. When a certain point of the fiber experiences strain or temperature variations, the corresponding reflected wavelength in the trace shifts from the baseline by an amount ΔλR defined by the relation:where Kε and KT are the strain and temperature coefficients, respectively, while νR and ΔνR are the corresponding reference frequency and frequency shift. All the experiments were performed at constant ambient temperature to filter any undesired thermal evolution, and thus the temperature term KT∆T can be neglected. For what concerns the strain term Kεε, the strain coefficient Kε is defined as:where ρε is the photoelastic coefficient, which is calculated with the following formula:where p11 and p12 are the components of the strain optic tensor, while ν is Poisson’s ratio [18]. For standard germanium doped silica fibers, like the ones used in this work, the photoelastic coefficient is known to be equal to 0.22. As a result, the strain coefficient should be equal to 0.78. Knowing these parameters and the central wavelength of the scanning process, it is possible to determine the relation between the strain and the frequency shift as a linear function of the form:
From this formula, assuming = 1306 nm for this measurement, the value for α is found to be −5.59 με/GHz. While this value may be realistic, it is still affected by variable factors such as dopant species concentration in the fiber core and outer layer composition (including cladding and coating) which all contribute to the uncertainty of the estimation [19].
3.2 Test rig development, calibration and uncertainty quantification
The strain coefficient was ultimately found through an experimental calibration process, which involved the design of a specific test rig, shown in Figure 4a. The fibers were stretched by means of a high-precision linear actuator (Fig. 4b), with a travel range of 500 mm and a resolution of 0.01 mm, allowing for characterization of up to 3.500 ± 0.005 m of fibers.
Figure 4.Calibration setup: test rig (a), linear actuator (b) and controller (c).
The clamps holding the fiber (shown in Fig. 5) were realized with two aluminum plates on which the shape profile of the two cables, previously determined with the aid of a microscope, was engraved on both sides with a high precision CNC milling machine. This allowed the insertion of the cable inside the clamps applying a quasi-uniform pressure on the corresponding cable jackets, which is fundamental to preserve a sufficiently high signal to noise ratio. Once the clamps were properly set up, the cable prototype being measured could be switched by flipping the plates upside down.
Figure 5.Clamps in the test rig (a), CAD representation (b) and test cable insertion (c).
The calibration measurements involved measuring the frequency displacement while the fiber was subject to different strain values ranging from 0 to 4000 με, with a step of 100 με, equivalent to a displacement of 0.350 ± 0.005 mm. The results of the calibration for both cable designs are shown in Figure 6. From linear fitting, the respective α parameters, which were found as the inverse of the slopes, were determined to be α1 = −5.520 ± 0.018 με/GHz for the first cable and α2 = − 5.590 ± 0.023 με/GHz for the second one.
Figure 6.Calibration data for the first (a), and the second (b), cable prototypes.
The validity of these results, and in particular their accuracy, can be further verified using the methodology contained in reference [20]. In particular, it is shown that a preliminary, conservative estimate of the uncertainty for the α value can be obtained from the specifications of the testing rig through the formula:where L and ΔL are the length and displacement step respectively, while uL and uΔL are their uncertainties. Using the values for the testing rig (L = 3500 mm, uL = 5 mm, ΔL = 0.35 mm, uΔL = 0.005 mm) in equation (6), we obtain a relative uncertainty equal to 1.4%. Comparatively, the relative errors obtained for the alpha parameters of the first and second cable are respectively 0.33% and 0.41%, which are lower, as expected for the fact that they have been obtained by fitting multiple measurements. However, when experimental calibration is not possible, this approach provides conservative and reliable uncertainty quantification.
3.3 Experimental testing
Once the calibration process was complete, SWI could be used to evaluate the strain transfer properties of the two optical fiber cable designs. The sensing fibers were bonded through an epoxy adhesive (LOCTITE® EA 9466™) on the surface of an aluminum specimen, which was positioned in a tensile strength machine, as shown in Figure 7.
Figure 7.Aluminium specimen in the tensile strength machine.
Its dimensions were 300 mm in length, 8 mm in thickness and 20 mm in width, with a Young modulus of 71.7 GPa and a shear modulus of 26.9 GPa. The sensing cables were attached at the opposite sides of the specimen, in order to avoid any contact with the clamps of the tensile strain machine, which would have added unwanted bending radii. The minimum bonding length between the cable and the specimen required for a complete strain transfer was determined from the previously mentioned numerical model, which found optimal results for 270 mm.
During the experiment, the aluminum specimen was subjected to loads ranging from 5 kN to 25 kN (5, 10, 15 20 and 25 kN). Two electrical strain gauges were fixed on the opposite ends of the specimen length and used as a reference to measure the effective longitudinal strain value of the specimen. In particular, the average of their measurement was used as the asymptotic strain value that should be detected by the two sensing cables.
As further validation, the experimental results were compared with a known analytical model for strain transfer developed in [21], represented by the following formula:in which εf represents the strain profile of the fiber core, εh the strain profile in the host structure, L denotes the bonding length and x represents the spatial coordinate along the fiber axis. Finally, k corresponds to the shear lag parameter, and is the fundamental variable of the model, enclosing all the geometrical and mechanical aspect of the sensing cable and its interface with the structure. Specifically, the higher its value, the more efficiently the strain is transferred from the structure to the sensing cable. While in principle its value can be derived a priori exploiting the properties of the sensing cable, it is commonly considered more feasible to tune the value based on experimental data in order to correct the initial guess with a more accurate value.
4 Results
The results are summarized in Figure 8. Due to the symmetrical nature of the experiment, only one half of the strain profile is plotted (the first 135 mm of bonding length). The vertical line in both plots is chosen as the first bonding point between the cable and the aluminum specimen. The horizontal solid lines correspond to the reference strain value obtained by the two strain gauges for each load case. The diamond shaped symbols are the results obtained from the FEM numerical model. The SWI sensing measurements are represented by star symbols and are denoted in the legend with the DOF acronym. Finally, the dashed lines are the strain profiles predicted by the strain transfer model. The strain transfer improvement obtained in the second cable can be easily seen at the highest load levels, where even in the midline (x = 135 mm), there is a mismatch between the strain of the first sensing cable and the strain of the gauge, representing an incomplete strain transfer. On the other hand, the second developed sensing cable is always capable of reaching the strain level measured by the two strain gauges, proving it as a viable alternative for BOTDA sensing cables. In this case, since the strain transfer length is well above the BOTDA resolution limit due to the heavy cable jacket required for protection, the better cable is the one with the highest strain transfer efficiency. In addition, for both designs there is a consistent overlap between the experimentally obtained strain values for the sensing cable and the ones predicted with the numerical and theoretical models, showing how both these tools allow reliable predictions. As further evaluation of the fiber performance, the strain response of the temperature sensing fiber of the second cable design was also measured through the use of SWI and by subjecting it to different strain levels ranging from 200 to 400 με through the linear actuator. The results and the comparison with the response of the strain sensing fiber are shown in Figure 9, in a graph showing the distributed SWI measurements in terms of frequency shift (left y-axis) and the corresponding strain values (right y-axis) along the length of the fiber; in particular, the strain values in the right y-axis were calculated from the frequency shift values measured by SWI using equation (5). The horizontal dotted lines represent the expected true strain values, obtained by dividing the displacement of the actuators by the total length. Ideally, the strain sensing fiber measurements should match the theoretical strain values (horizontal lines), whereas the temperature sensing cable should be completely insensitive to strain. As can be seen from the figure, the strain sensing fiber matches the expected theoretical values. The fluctuations in the strain profile can be associated with non-uniform restrictions of the outer cable jacket or can be due to microscopical imperfections of the optical fiber itself. In the temperature compensation fiber, on the other hand, a residual strain equal to 12% of the total strain is still detected. These results were somehow expected since the temperature sensing cable will always retain a level of friction with the outer layer. Nevertheless, Figure 9 indicates that the strain fingerprint along the fiber is stable along the entire testing length for different strain levels. As a result, even in absence of perfect decoupling, results are consistent enough that temperature compensation can be achieved during the postprocessing phase.
Figure 8.Strain transfer of the first sensing cable (up) and second sensing cable (down). Horizontal lines: strains measured by the gauges. Stars: OBR measurements. Dashed lines: analytical model. Diamonds: numerical FEM model.
Figure 9.OBR characterization of the strain response for the strain and temperature sensing cables. Horizontal dashed lines: real strain of the linear actuator.
In this work, a sensing method based on SWI has been used to evaluate two newly manufactured optical fiber temperature and strain sensing cables. These cables are intended to be employed in Brillouin optical time domain analysis to extract temperature and strain spatial distributions in large structures at centimeter level spatial resolution. Of the two cable designs, the first one was intended to satisfy a series of requirements for effective strain sensing performance, but several construction issues compromised its strain transfer capabilities and prevented it from operating at optimal operating conditions, leading to the realization of the second design to solve them. Besides SWI, the two designs were also evaluated through numerical and analytical approaches. The results showed a good agreement between the experimental methods and both numerical and analytical models, showing that SWI is an effective method for characterizing the strain transfer behavior of optical sensing cables and that the numerical and analytical models can be considered reliable tools to make predictions. As expected, these results showed that the second design presented superior strain transfer capabilities, always reaching the same strain value of the actual specimen, proving it to be a viable alternative for BOTDA sensing. The first design, on the other hand, due to the issue detailed in this work, presented a mismatch between the strain detected by the cable and the one effectively applied to the specimen, especially at higher strain values.
References
[1] R. Di Sante. Fibre optic sensors for structural health monitoring of aircraft composite structures: recent advances and applications. Sensors, 15, 18666-18713(2015).
[2] F. Falcetelli, N. Yue, R. Di Sante, D. Zarouchas. Probability of detection, localization, and sizing: The evolution of reliability metrics in Structural Health Monitoring. Struct. Health Monit., 147592172110607(2021).
[3] R. Di Sante, L. Donati, E. Troiani, P. Proli. Evaluation of bending strain measurements in a composite sailboat bowsprit with embedded fibre Bragg gratings. Measurement, 54, 106-117(2014).
[4] F. Falcetelli, R. Di Sante, E. Troiani. Strategies for embedding optical fiber sensors in additive manufacturing structures. European Workshop on Structural Health Monitoring, P.Rizzo, A.Milazzo, 128, 362-371(2021).
[5] D. Marini, M. Iuliano, F. Bastianini, G. Bolognini. BOTDA sensing employing a modified brillouin fiber laser probe source. J. Light. Technol., 36, 1131-1137(2018).
[6] M.A. Soto, P.K. Sahu, S. Faralli, G. Sacchi, G. Bolognini, F. Di Pasquale, B. Nebendahl, C. Rueck. High performance and highly reliable Raman-based distributed temperature sensors based on correlation-coded OTDR and multimode graded-index fibers. Proc. SPIE, 66193B, 532-535(2017).
[7] F. Falcetelli, L. Rossi, R. Di Sante, G. Bolognini. Strain transfer in surface-bonded optical fiber sensors. Sensors, 20, 3100(2020).
[8] D. Marini, L. Rossi, F. Bastianini, G. Bolognini. Study of enhanced performance fiber Brillouin ring laser with wavelength-locking for sensing applications(2018).
[9] L. Rossi, D. Marini, F. Bastianini, G. Bolognini. Analysis of enhanced-performance fibre Brillouin ring laser for Brillouin sensing applications. Opt. Express, 27, 29448-29460(2019).
[10] G. Bolognini, S. Faralli, A. Chiuchiarelli, F. Falconi, F. Di Pasquale. High-power and low-RIN lasers for advanced first- and higher order Raman copumping. IEEE Photonics Technol. Lett., 18, 1591-1593(2006).
[11] M.A. Soto, M. Taki, G. Bolognini, F. Di Pasquale. Optimization of a DPP-BOTDA sensor with 25 cm spatial resolution over 60 km standard single-mode fiber using Simplex codes and optical pre-amplification. Opt. Express, 20, 6860-6869(2012).
[12] A.H. Hartog. An introduction to distributed optical fibre sensors(2017).
[13] D. Marini, L. Rossi, F. Bastianini, G. Bolognini. Enhanced-performance fibre Brillouin ring laser for Brillouin sensing applications. OSA Technical Digest Part F124-OFS, 2018, ThE71(2018).
[14] F. Bastianini, R. Di Sante, F. Falcetelli, D. Marini, G. Bolognini. Optical fiber sensing cables for Brillouin-based distributed measurements. Sensors, 19, 5172(2019).
[15] E.D. Moore, R.R. McLeod. Correction of sampling errors due to laser tuning rate fluctuations in swept-wavelength interferometry. Opt. Express, 16, 13139-13149(2008).
[16] D.K. Gifford, S.T. Kreger, A.K. Sang, M.E. Froggatt, R.G. Duncan, M.S. Wolfe, B.J. Soller. Swept-wavelength interferometric interrogation of fiber Rayleigh scatter for distributed sensing applications. Proceedings of the Fiber Optic Sensors and Applications V, 6770, 67700F(2007).
[17] B.J. Soller, M.S. Wolfe, M.E. Froggat. Polarization resolved measurement of Rayleigh backscatter in fiber-optic components. Proceedings of the OFC Technical Digest; NWD3(2005).
Francesco Falcetelli, Filippo Bastianini, Pawel Bocheński, Leonardo Rossi, Raffaella Di Sante, Gabriele Bolognini. Optical characterization of strain sensing cables for Brillouin optical time domain analysis[J]. Journal of the European Optical Society-Rapid Publications, 2022, 18(1): 2022007