Author Affiliations
1Beijing Key Laboratory of Precision Forestry, Beijing Forestry University, Beijing 100083, China2Key Laboratory of Land Surface Pattern and Simulation, Institute of Geographic Sciences and Natural Resources Research, CAS, Beijing 100101, China3State Key Laboratory of Earth Surface Processes and Resource Ecology, Beijing Normal University, Beijing 100875, Chinashow less
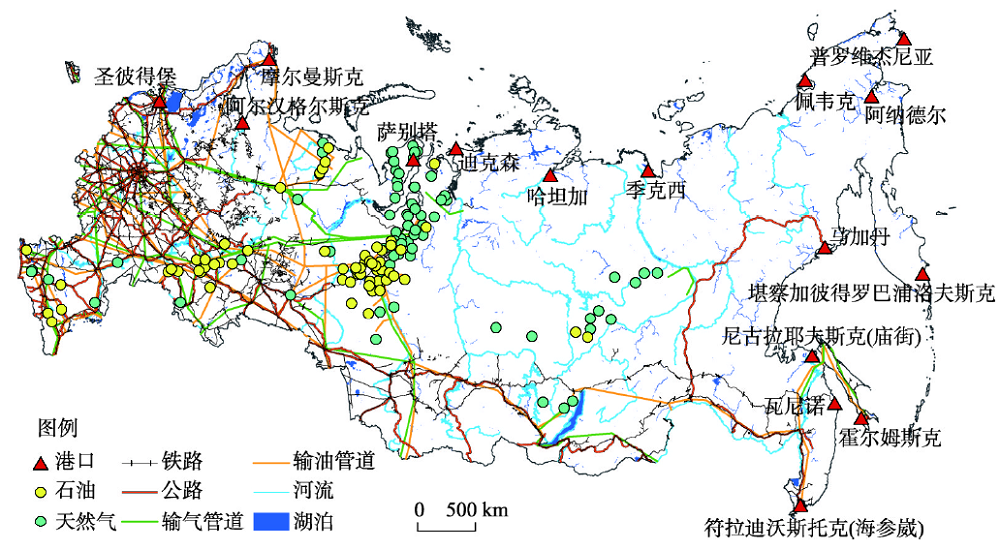
Fig. 1. General distribution of transportation and resources in Russia
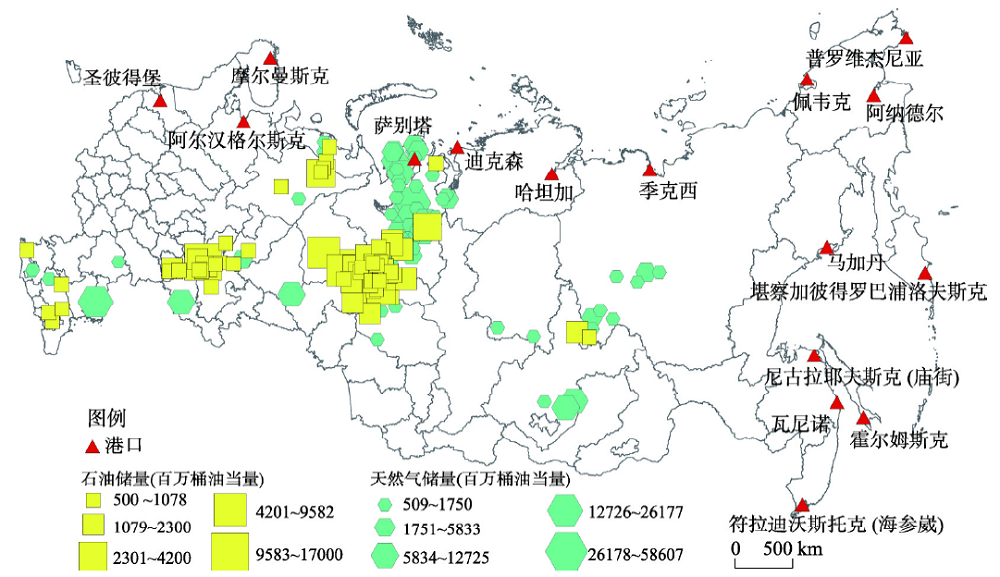
Fig. 2. Distribution of oil and gas resources according to production grade
Fig. 3. The resource accessibility of important ports in Russia
Fig. 4. Distribution of resources accessibility of ports
| 港口中文名称 | 港口英文名称 | 纬度 | 经度 |
|---|
| 阿纳德尔 | ANADYR | 64°44′20″N | 171°31′12″E | | 阿尔汉格尔斯克 | ARKHANGELSK | 64°32′00″N | 40°31′00″E | | 迪克森 | DIKSON | 73°30′27″N | 80°23′47″E | | 哈坦加 | KHATANGA | 71°58′57″N | 102°28′17″E | | 霍尔姆斯克 | KHOLMSK | 47°03′02″N | 142°02′38″E | | 马加丹 | MAGADAN | 59°32′21″N | 150°46′26″E | | 摩尔曼斯克 | MURMANSK | 68°58′21″N | 33°02′46″E | | 尼古拉耶夫斯克(庙街) | NIKOLAEVSK ON AMUR | 53°07′56″N | 140°42′56″E | | 堪察加彼得罗巴浦洛夫斯克 | PETROPAVLOVSK-KAMCHATSKIY | 53°00′28″N | 158°38′59″E | | 佩韦克 | PEVEK | 69°42′06″N | 170°16′59″E | | 普罗维杰尼亚 | PROVIDENIJA | 64°24′12″N | 173°13′02″W | | 萨别塔 | SABETTA | 71°15′00″N | 72°06′10″E | | 圣彼得堡 | ST. PETERSBURG | 59°55′38″N | 30°13′48″E | | 季克西 | TIKSI | 71°38′35″N | 128°52′35″E | | 瓦尼诺 | VANINO | 49°05′06″N | 140°16′18″E | | 符拉迪沃斯托克(海参崴) | VLADIVOSTOK | 43°05′40″N | 131°53′25″E |
|
Table 1. Basic information on important Russian ports
| 运输方式 | 铁路 | 一级公路 | 二级公路 | 陆地 | 河流 | 湖泊 | 输油管道 | 输气管道 |
|---|
| 速度(km/h) | 100 | 120 | 80 | 20 | - | - | - | - | | 时间成本(min) | 6 | 5 | 7.5 | 30 | 300 | 600 | 3.7 | 2.47 |
|
Table 2. Relative time cost value setting of different transport modes and land use types
| 资源种类 | 资源规模 |
|---|
| 大型 | 特大型 | 巨型 |
|---|
| 石油 | 64 | 5 | - | | 天然气 | 60 | 10 | 1 |
|
Table 3. An overview of the quantity of oil and gas resources at all scales (based on worldmap)
| 资源种类 | NNI | 分布类型 | z得分 | p值 |
|---|
| 石油 | 0.43 | 聚集 | -8.98 | 0.00 | | 天然气 | 0.60 | 聚集—随机 | -6.42 | 0.00 |
|
Table 4. Nearest neighbor index of resources
| 时间(h) | 阿纳德尔 | 阿尔汉格尔斯克 | 迪克森 | 哈坦加 | 霍尔姆斯克 | 马加丹 | 摩尔曼斯克 | 尼古拉耶夫斯克(庙街) |
|---|
| 0~28 | 4645 | 59867 | 3436 | 5755 | 15460 | 10288 | 51500 | 13560 | | 28~45 | 4978 | 27404 | 15675 | 6567 | 29718 | 22276 | 28822 | 27711 | | 45~58 | 2439 | 19493 | 52412 | 7301 | 45135 | 30987 | 20450 | 41235 | | 58~70 | 3419 | 14985 | 28068 | 17391 | 36385 | 30783 | 15461 | 40273 | | 70~85 | 7492 | 15581 | 21221 | 42675 | 17366 | 51199 | 16875 | 19377 | | 85~105 | 19480 | 14962 | 21121 | 53645 | 14220 | 16149 | 16744 | 15094 | | > 105 | 125099 | 15261 | 25620 | 34218 | 9269 | 5871 | 17700 | 10302 | | 时间(h) | 堪察加彼得罗巴浦洛夫斯克 | 佩韦克 | 普罗维杰尼亚 | 萨别塔 | 圣彼得堡 | 季克西 | 瓦尼诺 | 符拉迪沃斯托克(海参崴) | | 0~28 | 1928 | 3770 | 1454 | 2198 | 63227 | 4323 | 21668 | 21348 | | 28~45 | 639 | 5404 | 2516 | 50202 | 26871 | 6997 | 36166 | 36449 | | 45~58 | 344 | 4011 | 2523 | 27857 | 19600 | 8917 | 51210 | 49528 | | 58~70 | 902 | 3237 | 2525 | 19545 | 14280 | 15777 | 23785 | 24776 | | 70~85 | 3086 | 6957 | 3026 | 18937 | 15395 | 33815 | 15087 | 15233 | | 85~105 | 7579 | 18265 | 6139 | 21297 | 13834 | 62455 | 12197 | 12510 | | > 105 | 153073 | 125907 | 149368 | 27516 | 14346 | 35269 | 7439 | 7709 |
|
Table 5. Classification analysis of accessible area of each port (100 km2)
| 港口 | 0~28 | 28~45 | 45~58 | 58~70 | 70~85 | 85~105 | > 105 | 到所有油田总时间(h) |
|---|
| 阿纳德尔 | 0 | 0 | 0 | 0 | 0 | 0 | 69 | 8755.64 | | 阿尔汉格尔斯克 | 66 | 0 | 3 | 0 | 0 | 0 | 0 | 1363.62 | | 迪克森 | 1 | 30 | 31 | 5 | 2 | 0 | 0 | 3341.22 | | 哈坦加 | 0 | 0 | 0 | 1 | 50 | 18 | 0 | 5592.39 | | 霍尔姆斯克 | 0 | 35 | 28 | 5 | 1 | 0 | 0 | 3250.98 | | 马加丹 | 0 | 0 | 0 | 52 | 16 | 1 | 0 | 4547.45 | | 摩尔曼斯克 | 63 | 3 | 1 | 2 | 0 | 0 | 0 | 1588.87 | | 尼古拉耶夫斯克(庙街) | 0 | 30 | 33 | 5 | 1 | 0 | 0 | 3374.88 | | 堪察加彼得罗巴浦洛夫斯克 | 0 | 0 | 0 | 0 | 0 | 0 | 69 | 10990.72 | | 佩韦克 | 0 | 0 | 0 | 0 | 0 | 0 | 69 | 8802.06 | | 普罗维杰尼亚 | 0 | 0 | 0 | 0 | 0 | 0 | 69 | 10939.48 | | 萨别塔 | 0 | 61 | 6 | 0 | 2 | 0 | 0 | 2716.00 | | 圣彼得堡 | 66 | 0 | 3 | 0 | 0 | 0 | 0 | 1302.04 | | 季克西 | 0 | 0 | 0 | 0 | 0 | 62 | 7 | 6763.85 | | 瓦尼诺 | 0 | 47 | 21 | 1 | 0 | 0 | 0 | 2901.39 | | 符拉迪沃斯托克(海参崴) | 0 | 50 | 18 | 1 | 0 | 0 | 0 | 2835.73 |
|
Table 6. The number and time of oil fields reached by important ports in Russia
| 港口 | 0~28 | 28~45 | 45~58 | 58~70 | 70~85 | 85~105 | > 105 | 到所有气田总时间(h) |
|---|
| 阿纳德尔 | 0 | 0 | 0 | 0 | 0 | 3 | 68 | 9710.88 | | 阿尔汉格尔斯克 | 43 | 18 | 2 | 4 | 3 | 1 | 0 | 2137.29 | | 迪克森 | 4 | 28 | 19 | 10 | 2 | 8 | 0 | 3703.39 | | 哈坦加 | 0 | 0 | 7 | 28 | 27 | 9 | 0 | 5024.80 | | 霍尔姆斯克 | 0 | 4 | 20 | 28 | 13 | 6 | 0 | 4498.87 | | 马加丹 | 0 | 3 | 5 | 14 | 31 | 15 | 3 | 5380.72 | | 摩尔曼斯克 | 30 | 25 | 8 | 1 | 6 | 1 | 0 | 2570.07 | | 尼古拉耶夫斯克(庙街) | 0 | 4 | 14 | 33 | 13 | 7 | 0 | 4659.74 | | 堪察加彼得罗巴浦洛夫斯克 | 0 | 0 | 0 | 0 | 0 | 0 | 71 | 12010.74 | | 佩韦克 | 0 | 0 | 0 | 0 | 0 | 3 | 68 | 9758.65 | | 普罗维杰尼亚 | 0 | 0 | 0 | 0 | 0 | 0 | 71 | 11958.02 | | 萨别塔 | 12 | 43 | 4 | 4 | 1 | 6 | 1 | 2911.39 | | 圣彼得堡 | 50 | 13 | 0 | 5 | 2 | 1 | 0 | 1906.53 | | 季克西 | 0 | 0 | 3 | 1 | 6 | 38 | 23 | 7111.96 | | 瓦尼诺 | 0 | 6 | 35 | 14 | 13 | 3 | 0 | 4191.74 | | 符拉迪沃斯托克(海参崴) | 0 | 4 | 35 | 16 | 12 | 4 | 0 | 4245.49 |
|
Table 7. The number and time of gas fields reached by important ports in Russia
| 港口 | 油田加权平均旅行时间(h) | 气田加权平均旅行时间(h) | 加权平均旅行时间(h) |
|---|
| 圣彼得堡 | 17.91 | 20.83 | 19.37 | | 阿尔汉格尔斯克 | 18.65 | 24.01 | 21.33 | | 摩尔曼斯克 | 21.92 | 30.17 | 26.05 | | 萨别塔 | 38.04 | 35.26 | 36.65 | | 迪克森 | 47.08 | 46.60 | 46.84 | | 符拉迪沃斯托克(海参崴) | 39.78 | 59.09 | 49.44 | | 瓦尼诺 | 40.73 | 58.48 | 49.61 | | 霍尔姆斯克 | 45.79 | 62.85 | 54.32 | | 尼古拉耶夫斯克(庙街) | 47.59 | 65.11 | 56.35 | | 马加丹 | 64.58 | 76.39 | 70.49 | | 哈坦加 | 80.04 | 68.88 | 74.46 | | 季克西 | 96.86 | 102.12 | 99.49 | | 阿纳德尔 | 125.57 | 137.37 | 131.47 | | 佩韦克 | 126.25 | 138.05 | 132.15 | | 普罗维杰尼亚 | 157.22 | 169.02 | 163.12 | | 堪察加彼得罗巴浦洛夫斯克 | 157.96 | 169.77 | 163.87 |
|
Table 8. The ports' weighted average travel time
| 港口 | 石油区位优势潜力 | 天然气区位优势潜力 | 综合资源区位优势潜力 |
|---|
| 圣彼得堡 | 7899 | 16811 | 12355 | | 阿尔汉格尔斯克 | 7241 | 13864 | 10553 | | 摩尔曼斯克 | 6037 | 10381 | 8209 | | 萨别塔 | 3348 | 12387 | 7867 | | 迪克森 | 2701 | 6525 | 4613 | | 符拉迪沃斯托克(海参崴) | 3186 | 4943 | 4064 | | 瓦尼诺 | 3109 | 5013 | 4061 | | 霍尔姆斯克 | 2757 | 4635 | 3696 | | 尼古拉耶夫斯克(庙街) | 2651 | 4459 | 3555 | | 马加丹 | 1943 | 3782 | 2863 | | 哈坦加 | 1565 | 4153 | 2859 | | 季克西 | 1291 | 2795 | 2043 | | 阿纳德尔 | 995 | 2053 | 1524 | | 佩韦克 | 990 | 2043 | 1516 | | 普罗维杰尼亚 | 794 | 1663 | 1229 | | 堪察加彼得罗巴浦洛夫斯克 | 791 | 1656 | 1223 |
|
Table 9. The ports' resource potential location advantage