Yi Zheng, Cheng-Jie Zhang, Zheng-Hao Liu, Jian-Wei Shao, Jin-Shi Xu, Chuan-Feng Li, Guang-Can Guo, "Experimental verification of a coherence factorization law for quantum states," Photonics Res. 10, 2172 (2022)

Search by keywords or author
- Photonics Research
- Vol. 10, Issue 9, 2172 (2022)
![Illustration of the coherence factorization law under genuinely incoherent operation (GIO) Φ. The coherence measure G(ρ) is calculated from the off-diagonal elements of the density matrix. After GIO, the coherence is multiplied by G[Φ(|ψ+⟩⟨ψ+|)], where |ψ+⟩ is the maximally coherent state (MCS).](/richHtml/prj/2022/10/9/2172/img_001.jpg)
Fig. 1. Illustration of the coherence factorization law under genuinely incoherent operation (GIO) Φ . The coherence measure G ( ρ ) is calculated from the off-diagonal elements of the density matrix. After GIO, the coherence is multiplied by G [ Φ ( | ψ + ⟩ ⟨ ψ + | ) ] , where | ψ + ⟩ is the maximally coherent state (MCS).

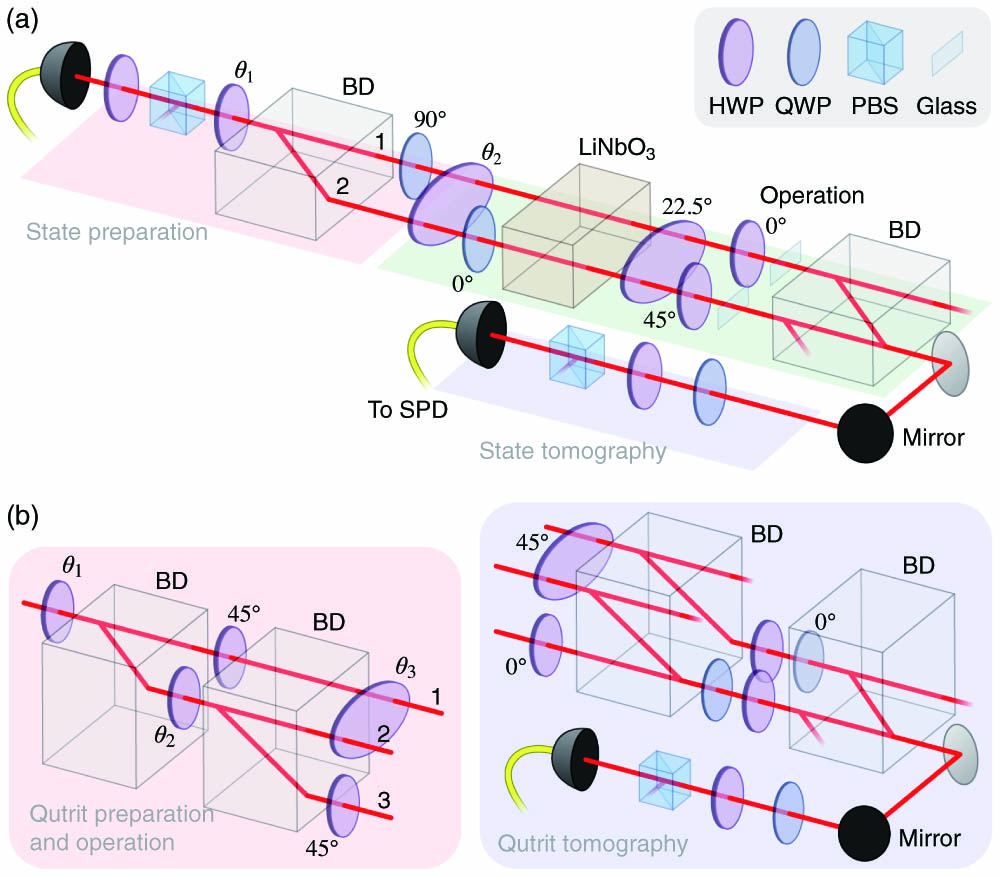
Fig. 2. (a) Setup of the qubit coherence factorization law verification experiment. The photons are prepared as the initial state using a half-wave plate (HWP) with its fast axis at angle θ 1 and a beam displacer (BD). An HWP at θ 2 controls the operation, and two quarter-wave plates add a phase factor i at path 2. A thick lithium niobate (LiNbO 3 ) crystal destroys the coherence between horizontally (H ) and vertically (V ) polarized components, and several HWPs erase the difference between the two polarizations. Two thin glass plates compensate for the phase difference between two paths before they are merged by another BD. A QWP, an HWP, and a PBS perform state tomography, and the photons are counted by a single-photon detector (SPD). (b) Essential parts of the qutrit experiment. The initial state is prepared using three HWPs and two BDs. The first HWP is at θ 1 = 17.6 ° so that sin 2 θ 1 ≈ 1 / 3 . The HWP at θ 3 acts at the two paths on the top, and another HWP switches the photons at V polarization at the bottom path to the H one. The tomography part is after the 22.5° HWP. Wave plates, two BDs, and a PBS are used to project the photonic state to eigenstates of the Gell-Mann matrices.

Fig. 3. Experimental results for qubit experiment. (a) Measured coherence G for different initial states controlled by θ 1 and the theoretical curve sin 4 θ 1 . (b)–(e) Measured G of the final state after operation with different θ 1 values (red dots), product of the measured G of the initial state and measured G of the maximally coherent state (MCS, when θ 2 = 22.5 ° ) after operation (blue dots), and theoretical curves | sin 4 θ 1 sin 4 θ 2 | / 2 (gray curves). The error bars from the 3 σ deviations of Poisson distribution are all smaller than the size of the dots and are thus omitted.

Fig. 4. (a) Moduli of density matrix elements | ρ i j | from the state tomography of qutrit maximally coherent state (MCS) after phase damping operation when θ 3 = 0 ° , 15°, 30°, and 45°. (b) Measured G of the final qutrit state after operation (red dots) and theoretical curves G ( ρ ) | sin 4 θ 2 cos 2 θ 3 | 2 / 3 when θ 2 = 22.5 ° (MCS), where G ( ρ ) = 1 , and θ 2 = 7.5 ° , where G ( ρ ) = 2 − 2 / 3 , with the products of G values of the initial state and the MCS after operation (blue dots). When θ 3 = 45 ° , the value deviates from zero from the error amplification when taking cubic roots, and the dots are replaced by hollow circles. The error bars correspond to 3 σ deviations of Poisson distribution.
![G values (light red curves) of the qutrit mixed state ρ=(1−p)|ψ+⟩⟨ψ+|+p|ψ′⟩⟨ψ′| (0≤p≤1) after phase damping operation with θ3=0°, 7.5°, 15°, 22.5°, 30°, and 37.5° from the weighted averages of the count data, and product values G(ρ)G[Φ(|ψ+⟩⟨ψ+|)] (light blue curves). Measured G and product values from the experiment are shown as red and blue dots, respectively.](/Images/icon/loading.gif)
Fig. 5. G values (light red curves) of the qutrit mixed state ρ = ( 1 − p ) | ψ + ⟩ ⟨ ψ + | + p | ψ ′ ⟩ ⟨ ψ ′ | (0 ≤ p ≤ 1 ) after phase damping operation with θ 3 = 0 ° , 7.5°, 15°, 22.5°, 30°, and 37.5° from the weighted averages of the count data, and product values G ( ρ ) G [ Φ ( | ψ + ⟩ ⟨ ψ + | ) ] (light blue curves). Measured G and product values from the experiment are shown as red and blue dots, respectively.

Set citation alerts for the article
Please enter your email address