
Charles F. Wu, Yao Zhao, Su-Ming Weng, Min Chen, Zheng-Ming Sheng. Nonlinear evolution of stimulated scattering near 1/4 critical density [J]. Acta Physica Sinica, 2019, 68(19): 195202-1
- Acta Physica Sinica
- Vol. 68, Issue 19, 195202-1 (2019)
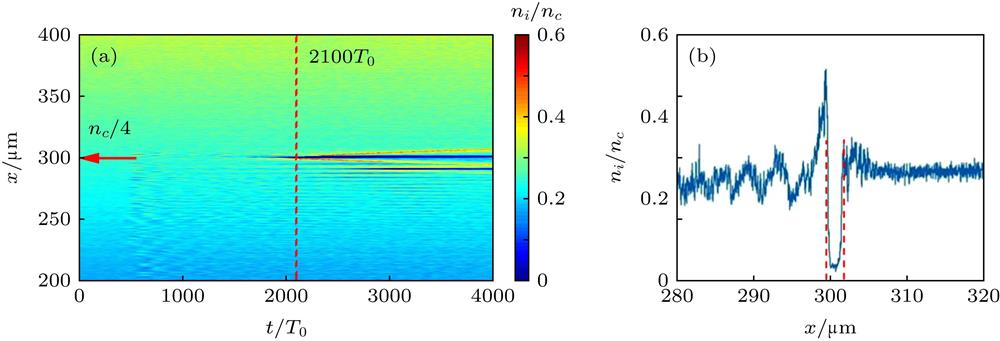
Fig. 1. (a) Temporal and spatial variation of ion density distribution; (b) the ion density distribution at 2100T 0. The red dotted line marks the density cavity with the width of 2λ 0.
(a)随时间变化的离子密度分布; (b) 2100T 0时刻的离子密度分布
![(a) Spatio-temporal evolution of the electric field Ey, Ey is normalized to El, which is the electric field intensity of incident laser; (b) distribution of electric field in (k, ω) space corresponding to the time window [0−2000]T0 and the space window [200−400] μm; (c) distribution of electric field in (k, ω) space corresponding to the time window [2000−4000]T0 and the space window [200−400] μm.(a)归一化电场Ey的时空演化图, 其中的归一化量纲El为入射激光的电场强度; (b) 0−2000T0, 200−400 μm等离子体中的电场Ey在k – ω空间中的分布; (c) 2000T0−4000T0, 200−400 μm等离子体中的电场Ey在k – ω空间中的分布](/richHtml/wlxb/2019/68/19/20190883/img_2.jpg)
Fig. 2. (a) Spatio-temporal evolution of the electric field Ey , Ey is normalized to El , which is the electric field intensity of incident laser; (b) distribution of electric field in (k , ω ) space corresponding to the time window [0−2000]T 0 and the space window [200−400] μm; (c) distribution of electric field in (k , ω ) space corresponding to the time window [2000−4000]T 0 and the space window [200−400] μm.
(a)归一化电场Ey 的时空演化图, 其中的归一化量纲El 为入射激光的电场强度; (b) 0−2000T 0, 200−400 μm等离子体中的电场Ey 在k – ω 空间中的分布; (c) 2000T 0−4000T 0, 200−400 μm等离子体中的电场Ey 在k – ω 空间中的分布
Fig. 3. (a) Comparison of the generation time of plasma density cavity with different initial electron temperatures at quarter critical density; (b) comparison of the generation time of plasma density cavity with different initial ion temperatures at quarter critical density.(a)在不同的初始电子温度下, 1/4临界密度处等离子体密度坑的产生时间对比; (b)在不同的初始离子温度下, 1/4临界密度处等离子体密度坑的产生时间对比
Fig. 4. (a) Temporal and spatial variation of ion density distribution; (b) after the formation of density cavities, the ions near the density cavities have been accelerated to a higher energy at the moment of 3200T 0.
(a)随时空变化的离子密度分布; (b)密度坑产生后, 在3200T 0时刻, 密度坑附近的离子被加速到较高的能量
Fig. 5. (a), (c), (e) Temporal and spatial variation of ion density distribution in different time windows; (b), (d), (f) the longitudinal field Ex in (x , ω ) space. The ion and Ex distribution represent the development of instability regions and parametric instability, respectively.
(a), (c), (e)不同时间段中的离子密度在x – t 空间中的分布; (b), (d), (f)不同时间段中的纵向电场Ex 在x – ω 空间中的分布; 这些离子密度以及纵向电场的分布, 分别反映了不稳定区域或激光等离子体不稳定性的发展情况
Fig. 6. (a), (c) The Ex distribution in (k , ω ) space corresponding to the time window [0−2000]T 0; (b), (d) the Ex distribution in (k , ω ) space corresponding to the time window [2000T 0−4000]T 0. The longitudinal field Ex represents the development of SRS and SBS instabilities in the different time windows, respectively.
(a), (c) 0−2000T 0纵场Ex 在k -ω 空间的分布; (b), (d) 2000T 0−4000T 0纵场Ex 在k – ω 空间的分布, 相应频率与波矢的纵场Ex , 分别对应了SBS和SRS不稳定性的发展
Fig. 7. (a) The temporal evolution of left traveling wave in frequency space; (b) the temporal evolution of SRS; (c) the temporal evolution of SBS.(a)左行波在频率空间中随时间的变化; (b) SRS的份额随时间的变化; (c) SBS的份额随时间的变化

Set citation alerts for the article
Please enter your email address
© Copyright 2018-2021 | Chinese Laser Press. All Rights Reserved 沪ICP备15018463号-20