• Chinese Physics B
  • Vol. 29, Issue 9, (2020)
Di Ai1, Hao Qiao1, Shuang Zhang1, Li-Meng Luo1, Chang-Yue Sun1, Sheng Zhang1, Cheng-Quan Peng1, Qi-Chao Qi1, Tao-Yun Jin1, Min Zhou1, and Xin-Ye Xu1、2、†
Author Affiliations
  • 1State Key Laboratory of Precision Spectroscopy, East China Normal University, Shanghai 200062, China
  • 2Shanghai Research Center for Quantum Sciences, Shanghai 01315, China
  • show less
    DOI: 10.1088/1674-1056/aba099 Cite this Article
    Di Ai, Hao Qiao, Shuang Zhang, Li-Meng Luo, Chang-Yue Sun, Sheng Zhang, Cheng-Quan Peng, Qi-Chao Qi, Tao-Yun Jin, Min Zhou, Xin-Ye Xu. Study of optical clocks based on ultracold 171Yb atoms[J]. Chinese Physics B, 2020, 29(9): Copy Citation Text show less
    Relevant energy levels of the ytterbium atomic clock. Lasers for two cooling transitions (399 nm and 556 nm), optical lattice (759 nm), clock transition (578 nm), and two re-pumping transitions (649 nm and 770 nm).
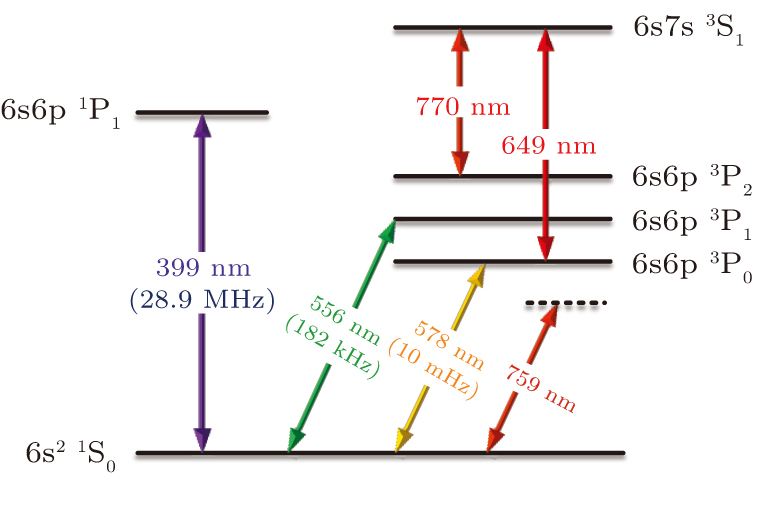
    Fig. 1. Relevant energy levels of the ytterbium atomic clock. Lasers for two cooling transitions (399 nm and 556 nm), optical lattice (759 nm), clock transition (578 nm), and two re-pumping transitions (649 nm and 770 nm).
    Schematic diagram of the experimental setup. The 578-nm clock laser is generated by frequency doubling of a 1156-nm laser, and we send part of it to the lattice system for clock interrogation and small part of it to an optical frequency comb for stabilizing the repetition frequency of the comb and measuring the absolute frequency of 171Yb. The frequency of LL1 is locked to the comb, and LL2 is offset locked to LL1. PBS: polarizing beam splitter; FNC: fiber noise cancellation; PMT: photomultiplier; GP: Glan polarizer; PDH: Pound–Drever–Hall.
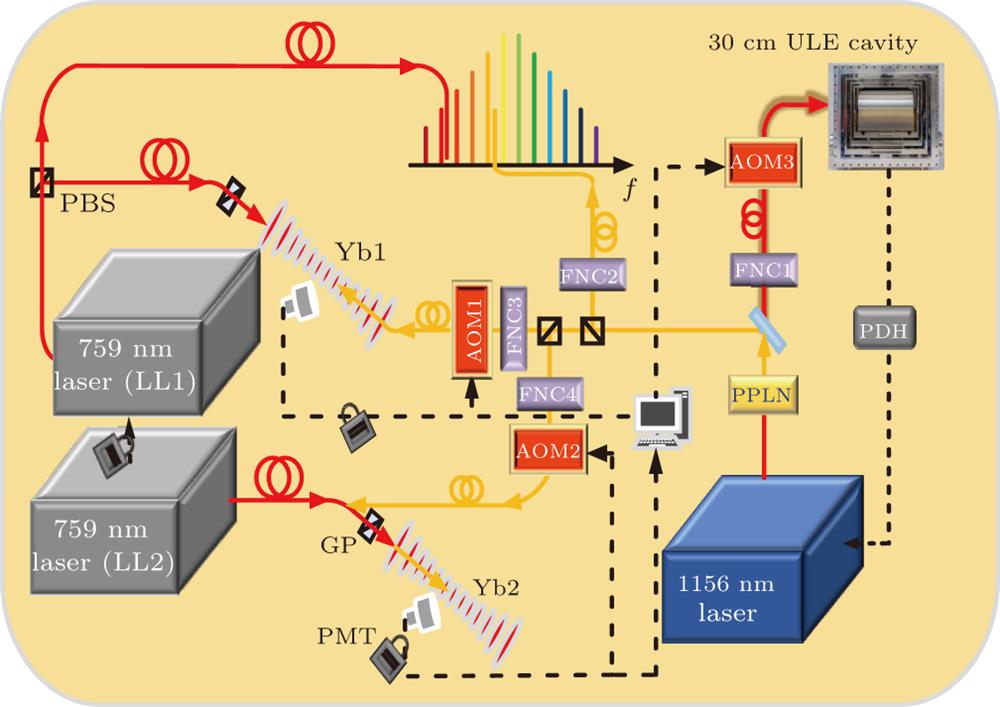
    Fig. 2. Schematic diagram of the experimental setup. The 578-nm clock laser is generated by frequency doubling of a 1156-nm laser, and we send part of it to the lattice system for clock interrogation and small part of it to an optical frequency comb for stabilizing the repetition frequency of the comb and measuring the absolute frequency of 171Yb. The frequency of LL1 is locked to the comb, and LL2 is offset locked to LL1. PBS: polarizing beam splitter; FNC: fiber noise cancellation; PMT: photomultiplier; GP: Glan polarizer; PDH: Pound–Drever–Hall.
    Simplified experimental setup of 1156-nm ultra-stable laser system. PBS: polarizing beam splitter; PD: photo diode; AOM: acousto–optic modulator; EOM: electro–optic modulator; GP: Glan polarizer; λ/2: 1/2 waveplate, λ/4: 1/4 waveplate.
    Fig. 3. Simplified experimental setup of 1156-nm ultra-stable laser system. PBS: polarizing beam splitter; PD: photo diode; AOM: acousto–optic modulator; EOM: electro–optic modulator; GP: Glan polarizer; λ/2: 1/2 waveplate, λ/4: 1/4 waveplate.
    Sectional view of 1156-nm ultra-stable FP cavity system.
    Fig. 4. Sectional view of 1156-nm ultra-stable FP cavity system.
    Determination of the zero coefficient of thermal expansion temperature for the FP cavity. Each data point is measured for different cavity temperatures once the temperature in the vacuum chamber is stable.
    Fig. 5. Determination of the zero coefficient of thermal expansion temperature for the FP cavity. Each data point is measured for different cavity temperatures once the temperature in the vacuum chamber is stable.
    The temperature fluctuation of EOM under temperature control.
    Fig. 6. The temperature fluctuation of EOM under temperature control.
    Normalized clock transition spectra of π component in 171Yb. Blue and red points are the data for interrogation times of 200 ms and 600 ms, respectively. Employing Lorenz fit to the signal produces the FWHM linewidth of 1.92 Hz (red curve) and 4.53 Hz (blue curve).
    Fig. 7. Normalized clock transition spectra of π component in 171Yb. Blue and red points are the data for interrogation times of 200 ms and 600 ms, respectively. Employing Lorenz fit to the signal produces the FWHM linewidth of 1.92 Hz (red curve) and 4.53 Hz (blue curve).
    (a) The in-loop error signal. (b) Instability evaluation of the ytterbium clock using the atomic transition. Blue points give the in-loop instability (from the error signals) when the 578-nm laser is locked to the atomic transition, and the blue line shows an instability of 1.28×10⁻¹⁵/τ.
    Fig. 8. (a) The in-loop error signal. (b) Instability evaluation of the ytterbium clock using the atomic transition. Blue points give the in-loop instability (from the error signals) when the 578-nm laser is locked to the atomic transition, and the blue line shows an instability of 1.28×10¹⁵/τ.
    Single clock stability measured with a synchronous comparison between two 171Yb optical lattice clocks. The blue line indicates the measured instability of a single system is 4.60×10⁻¹⁶/τ. The black line shows the quantum projection noise (QNC) limit as 1.1×10⁻¹⁶/τ.
    Fig. 9. Single clock stability measured with a synchronous comparison between two 171Yb optical lattice clocks. The blue line indicates the measured instability of a single system is 4.60×10¹⁶/τ. The black line shows the quantum projection noise (QNC) limit as 1.1×10¹⁶/τ.
    Di Ai, Hao Qiao, Shuang Zhang, Li-Meng Luo, Chang-Yue Sun, Sheng Zhang, Cheng-Quan Peng, Qi-Chao Qi, Tao-Yun Jin, Min Zhou, Xin-Ye Xu. Study of optical clocks based on ultracold 171Yb atoms[J]. Chinese Physics B, 2020, 29(9):
    Download Citation