
Jintang Chen, Kai Zhang, Tingting Liu, Zhiyong Zou, Jiansen Li, Huiliang Wei, Wenhe Liao. Monitoring of Warping Deformation of Laser Powder Bed Fusion Formed parts[J]. Chinese Journal of Lasers, 2024, 51(16): 1602306
- Chinese Journal of Lasers
- Vol. 51, Issue 16, 1602306 (2024)
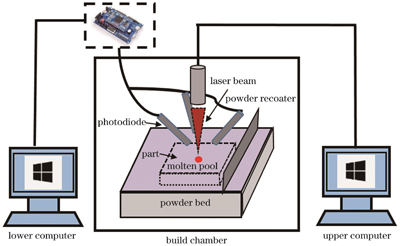
Fig. 1. Diagram of data acquisition equipment
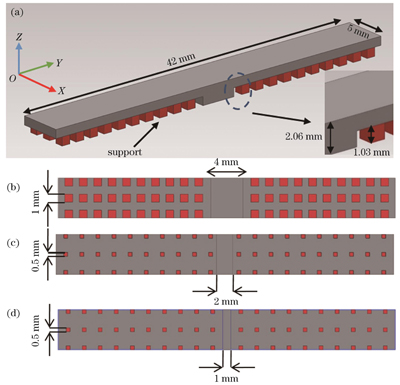
Fig. 2. Model and sizes of experimental samples. (a) Overall size of sample; (b) size of support cross section of samples 1 and 2; (c) size of support cross section of samples 3 and 4; (d) size of support cross section of sample 5
Fig. 3. Division method of X-Y sections of samples
Fig. 4. Measurement method of sample warp deformation. (a) Positions of nine measurement points; (b) definition of warp deformation
Fig. 5. Physical pictures of samples and corresponding light intensity mapping diagrams of overhanging bottom layer. (a) Sample S80-1; (b) sample S80-2; (c) sample S25-1; (d) sample S25-2; (e) sample S20
Fig. 6. Deformation amounts of samples
Fig. 7. Average light intensity corresponding to warping region (Y=0‒1 mm and Y=41‒42 mm) of layer 46
Fig. 8. Z-Y cross sections of samples and average light intensity distribution curves of overhanging first layers of samples along Y direction. Z-Y cross sections of samples (a1) S80, (a2) S25, and (a3) S20; average light intensity distribution curves of samples (b) S80-1, (c) S80-2, (d) S25-1, (e) S25-2, and (f) S20
Fig. 9. Z-Y cross sections of samples and interlayer evolution of light intensity in samples. Z-Y cross sections of samples (a1) S80, (a2) S25, and (a3) S20; interlayer evolution of light intensity in samples (b) S80-1, (c) S80-2, (d) S25-1, (e) S25-2, and (f) S20
|
Table 1. Dimensions of specimen
| ||||||||||||||||||||
Table 2. Forming parameters of samples

Set citation alerts for the article
Please enter your email address
© Copyright 2018-2021 | Chinese Laser Press. All Rights Reserved 沪ICP备15018463号-20