• Chinese Optics Letters
  • Vol. 18, Issue 2, 021901 (2020)
Quanxin Yang1, Xin Zhang2, Hongliang Liu1、*, Xuping Wang3, Yingying Ren4, Shan He1, Xiaojin Li1, and Pengfei Wu1、**
Author Affiliations
  • 1Tianjin Key Laboratory of Optoelectronic Sensor and Sensing Network Technology, Institute of Modern Optics, Nankai University, Tianjin 300071, China
  • 2Hubei Key Laboratory of Low Dimensional Optoelectronic Materials and Devices, Hubei University of Arts and Science, Xiangyang 441053, China
  • 3Advanced Materials Institute, Qilu University of Technology (Shandong Academy of Sciences), Jinan 250014, China
  • 4Shandong Provincial Engineering and Technical Center of Light Manipulations & Shandong Provincial Key Laboratory of Optics and Photonic Device, School of Physics and Electronics, Shandong Normal University, Jinan 250358, China
  • show less
    DOI: 10.3788/COL202018.021901 Cite this Article Set citation alerts
    Quanxin Yang, Xin Zhang, Hongliang Liu, Xuping Wang, Yingying Ren, Shan He, Xiaojin Li, Pengfei Wu. Dynamic relaxation process of a 3D super crystal structure in a Cu:KTN crystal[J]. Chinese Optics Letters, 2020, 18(2): 021901 Copy Citation Text show less
    Variation of relative permittivity against temperature and measurement frequency. Measurement is accomplished by a Tonghui 2830 LCR (inductance, capacitance, resistance) meter with 1Vpp sinusoidal signals at different frequencies. Thermal hysteresis loops are shown because of the crystal’s relaxor ferroelectric. As shown, data at decreasing temperatures are smoother, and as frequency increases, the whole intensity decreases without a change of curve shapes.
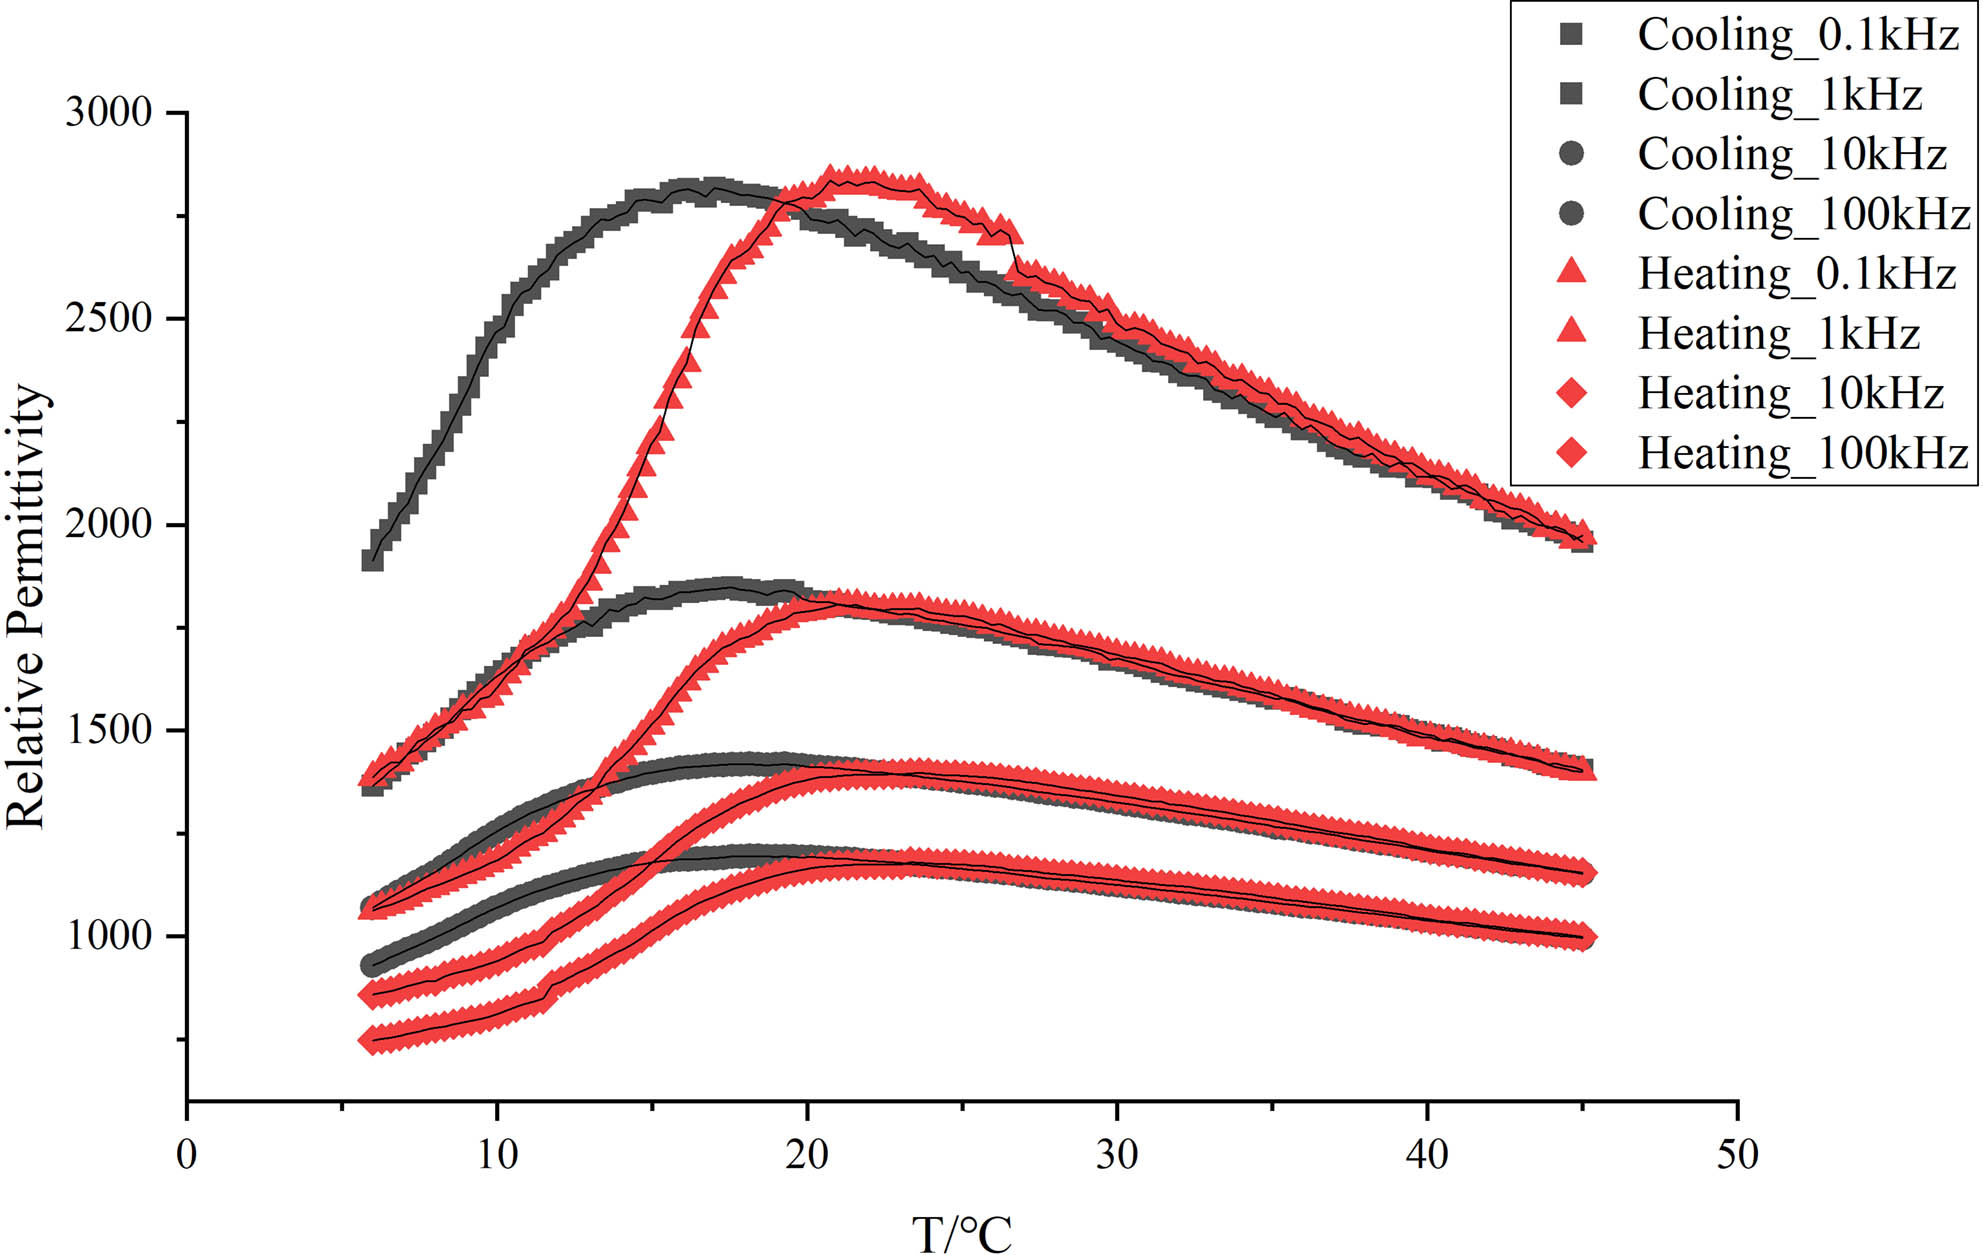
    Fig. 1. Variation of relative permittivity against temperature and measurement frequency. Measurement is accomplished by a Tonghui 2830 LCR (inductance, capacitance, resistance) meter with 1Vpp sinusoidal signals at different frequencies. Thermal hysteresis loops are shown because of the crystal’s relaxor ferroelectric. As shown, data at decreasing temperatures are smoother, and as frequency increases, the whole intensity decreases without a change of curve shapes.
    Sketch of the DLS experiment setup. A light beam with a 532 nm wavelength generated by a laser is first polarized and then shot into the crystal sample. After suffering strong diffraction in the sample, the light beam changes its direction. The pinholes and filter behind the sample make sure a light beam with a special direction can get through. Two polarizers with a V-H (vertical and horizontal) setup can pick up the light signal that has been influenced by the super crystal structure. To increase the capturing efficiency of the light signal, a lens is localized in front of the PMT.
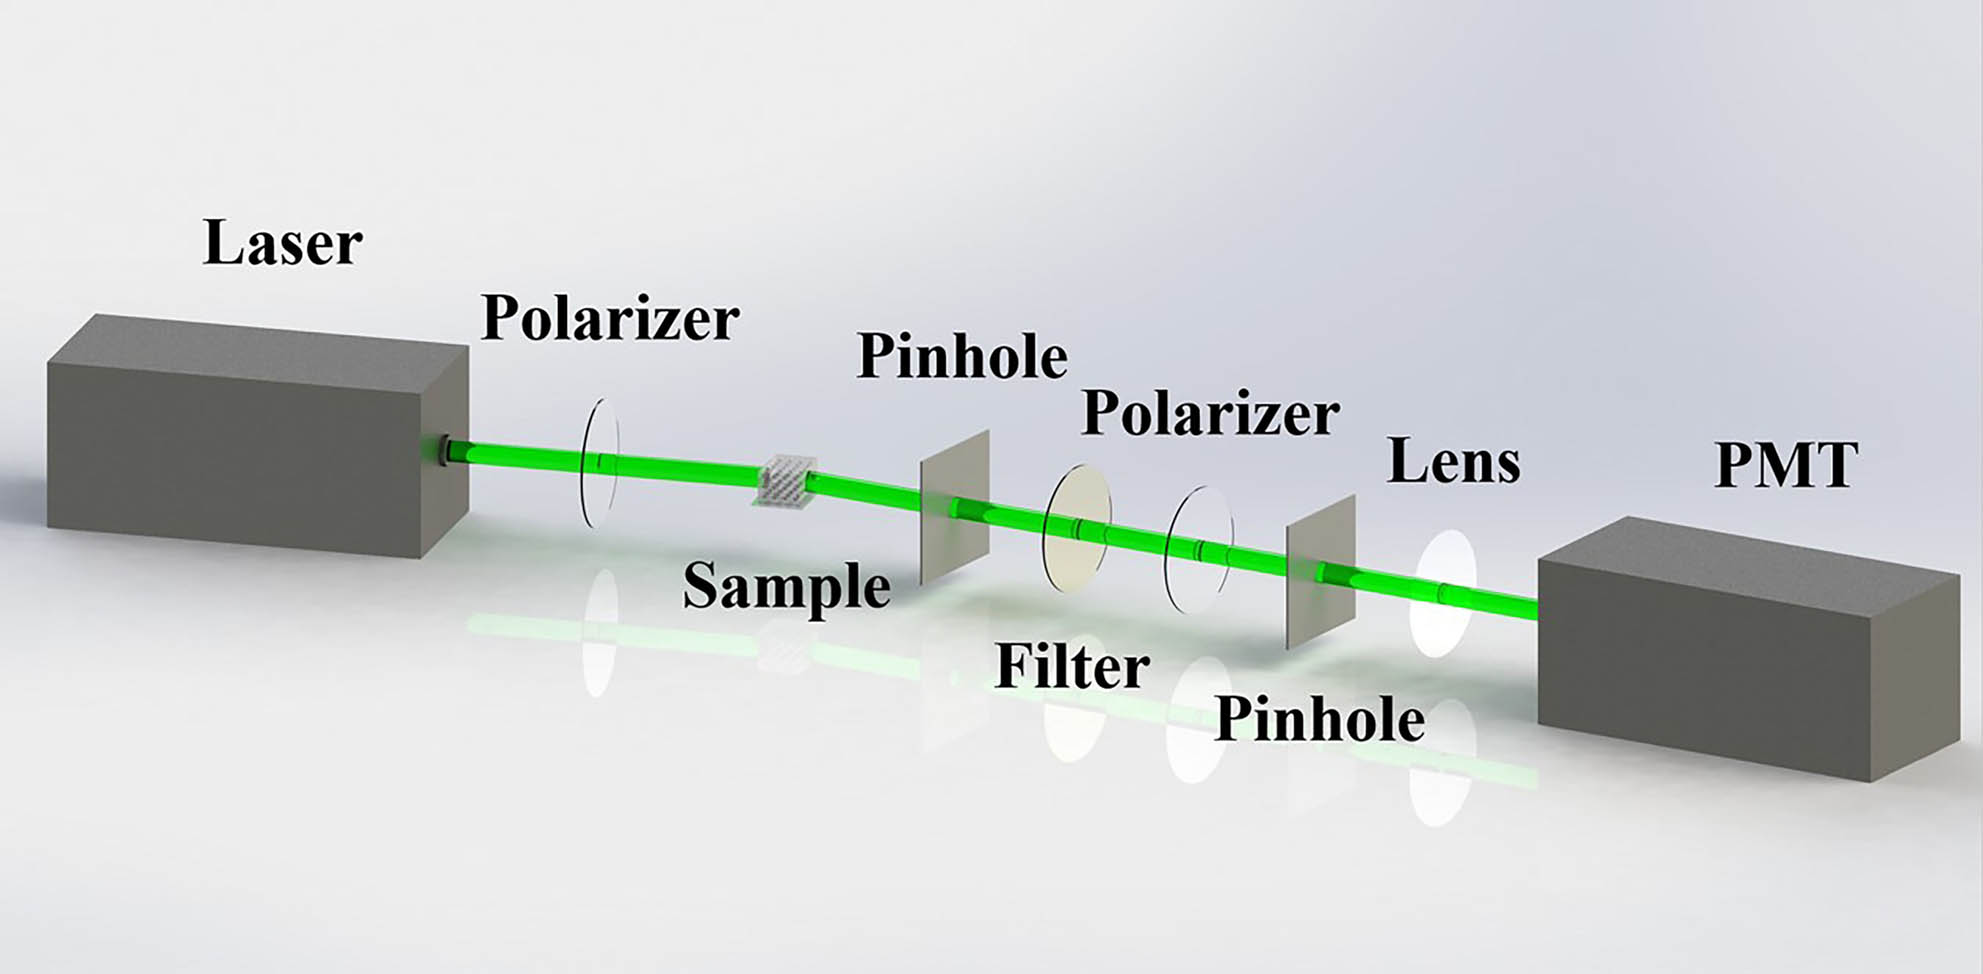
    Fig. 2. Sketch of the DLS experiment setup. A light beam with a 532 nm wavelength generated by a laser is first polarized and then shot into the crystal sample. After suffering strong diffraction in the sample, the light beam changes its direction. The pinholes and filter behind the sample make sure a light beam with a special direction can get through. Two polarizers with a V-H (vertical and horizontal) setup can pick up the light signal that has been influenced by the super crystal structure. To increase the capturing efficiency of the light signal, a lens is localized in front of the PMT.
    (a)–(c) Diagram of the 3D dynamic super crystal and the X-ray-diffraction-like phenomenon. (a) A diagram of a dynamic 3D super crystal structure full-filling the whole column. Due to 1.52 μm period that is very similar to the wavelength of the incident light beam (532 nm), the diffraction pattern is convenient to observe and analyze. (b) Strong diffraction caused by the dynamic structure. The built-in 1D order (periodical refractive index variety) is also shown. (c) Picture of diffraction pattern captured behind the sample. Spots pointed out by blue circles correspond to the 1st-order Bragg diffraction caused by the intrinsic 1D grating, and the spot pointed out by red circle corresponds to the diffraction phenomena caused by domain walls. The latter is utilized in the DLS experiment. (d)–(f) Microscopic mechanism during dynamic structure formation. (d) PNRs with orientation vertical to the interface of different layers form. (e) PNRs with orientation vertical to the interface have strong spontaneous polarization, and those with orientation horizontal to the interface have little during dynamic relaxation process. (f) The final dynamic structure. Red lines represent 90° domain walls.
    Fig. 3. (a)–(c) Diagram of the 3D dynamic super crystal and the X-ray-diffraction-like phenomenon. (a) A diagram of a dynamic 3D super crystal structure full-filling the whole column. Due to 1.52 μm period that is very similar to the wavelength of the incident light beam (532 nm), the diffraction pattern is convenient to observe and analyze. (b) Strong diffraction caused by the dynamic structure. The built-in 1D order (periodical refractive index variety) is also shown. (c) Picture of diffraction pattern captured behind the sample. Spots pointed out by blue circles correspond to the 1st-order Bragg diffraction caused by the intrinsic 1D grating, and the spot pointed out by red circle corresponds to the diffraction phenomena caused by domain walls. The latter is utilized in the DLS experiment. (d)–(f) Microscopic mechanism during dynamic structure formation. (d) PNRs with orientation vertical to the interface of different layers form. (e) PNRs with orientation vertical to the interface have strong spontaneous polarization, and those with orientation horizontal to the interface have little during dynamic relaxation process. (f) The final dynamic structure. Red lines represent 90° domain walls.
    Characteristic relaxation time calculated by fitting the ACF of two kinds of experiment data, equals 7.75 s and 32.93 s, respectively.
    Fig. 4. Characteristic relaxation time calculated by fitting the ACF of two kinds of experiment data, equals 7.75 s and 32.93 s, respectively.
    Quanxin Yang, Xin Zhang, Hongliang Liu, Xuping Wang, Yingying Ren, Shan He, Xiaojin Li, Pengfei Wu. Dynamic relaxation process of a 3D super crystal structure in a Cu:KTN crystal[J]. Chinese Optics Letters, 2020, 18(2): 021901
    Download Citation