• Photonics Research
  • Vol. 11, Issue 7, 1139 (2023)
Hao Yang1、2、†, Xuening Cao1、2、†, Zhi-Gang Hu1、2, Yimeng Gao1、2, Yuechen Lei1、2, Min Wang1、2, Zhanchun Zuo1、3, Xiulai Xu4, and Bei-Bei Li1、3、*
Author Affiliations
  • 1Beijing National Laboratory for Condensed Matter Physics, Institute of Physics, Chinese Academy of Sciences, Beijing 100190, China
  • 2University of Chinese Academy of Sciences, Beijing 100049, China
  • 3Songshan Lake Materials Laboratory, Dongguan 523808, China
  • 4State Key Laboratory for Mesoscopic Physics and Frontiers Science Center for Nano-optoelectronics, School of Physics, Peking University, Beijing 100871, China
  • show less
    DOI: 10.1364/PRJ.486849 Cite this Article Set citation alerts
    Hao Yang, Xuening Cao, Zhi-Gang Hu, Yimeng Gao, Yuechen Lei, Min Wang, Zhanchun Zuo, Xiulai Xu, Bei-Bei Li. Micropascal-sensitivity ultrasound sensors based on optical microcavities[J]. Photonics Research, 2023, 11(7): 1139 Copy Citation Text show less
    (a), (b) Simulated displacement distributions of the first- and second-order flapping modes, respectively. (c)–(f) Simulated pressure distributions of the microdisk (c), (d) without and (e), (f) with the trench structure, at the frequencies of the (c), (e) first-order and (d), (f) second-order flapping modes. In the simulations of (c)–(f), we use a two-dimensional axisymmetric model, with the axis of rotational symmetry located at the center of the microdisk (z axis), indicated by the arrows at the bottom. The ultrasonic wave with a sound pressure of 1 Pa is perpendicularly incident to the microdisk from above. The microdisk used here has a radius of 100 μm and a thickness of 2 μm. The pressure differences are (c) 0.68, (d) 1.91, (e) 1.35, and (f) 1.97, respectively. (g), (h) Simulated mechanical resonance frequencies of the flapping modes of 1 μm thick and 2 μm thick microdisks, respectively, as a function of the disk radius. (i), (j) Calculated sensitivities of microdisks, with thicknesses of 1 μm and 2 μm, respectively. The blue triangles and red squares represent the results of the first- and second-order flapping modes of the microdisk with a thickness of 1 μm. The black circles and green rhombuses represent the results of the first- and second-order flapping modes of the microdisk with a thickness of 2 μm.
    Fig. 1. (a), (b) Simulated displacement distributions of the first- and second-order flapping modes, respectively. (c)–(f) Simulated pressure distributions of the microdisk (c), (d) without and (e), (f) with the trench structure, at the frequencies of the (c), (e) first-order and (d), (f) second-order flapping modes. In the simulations of (c)–(f), we use a two-dimensional axisymmetric model, with the axis of rotational symmetry located at the center of the microdisk (z axis), indicated by the arrows at the bottom. The ultrasonic wave with a sound pressure of 1 Pa is perpendicularly incident to the microdisk from above. The microdisk used here has a radius of 100 μm and a thickness of 2 μm. The pressure differences are (c) 0.68, (d) 1.91, (e) 1.35, and (f) 1.97, respectively. (g), (h) Simulated mechanical resonance frequencies of the flapping modes of 1 μm thick and 2 μm thick microdisks, respectively, as a function of the disk radius. (i), (j) Calculated sensitivities of microdisks, with thicknesses of 1 μm and 2 μm, respectively. The blue triangles and red squares represent the results of the first- and second-order flapping modes of the microdisk with a thickness of 1 μm. The black circles and green rhombuses represent the results of the first- and second-order flapping modes of the microdisk with a thickness of 2 μm.
    (a) Top-view optical microscope image of a microdisk with a trench structure. The scale bar corresponds to 50 μm. (b) FEM simulated optical field distribution of the fundamental WGM of the microdisk. (c) Experimental setup to measure the microdisk response to ultrasound. PD, photodetector; VNA, vector network analyzer; OSC, oscilloscope; ESA, electronic spectrum analyzer. (d) Optical transmission spectrum of the microdisk, with an intrinsic Q factor of around 106.
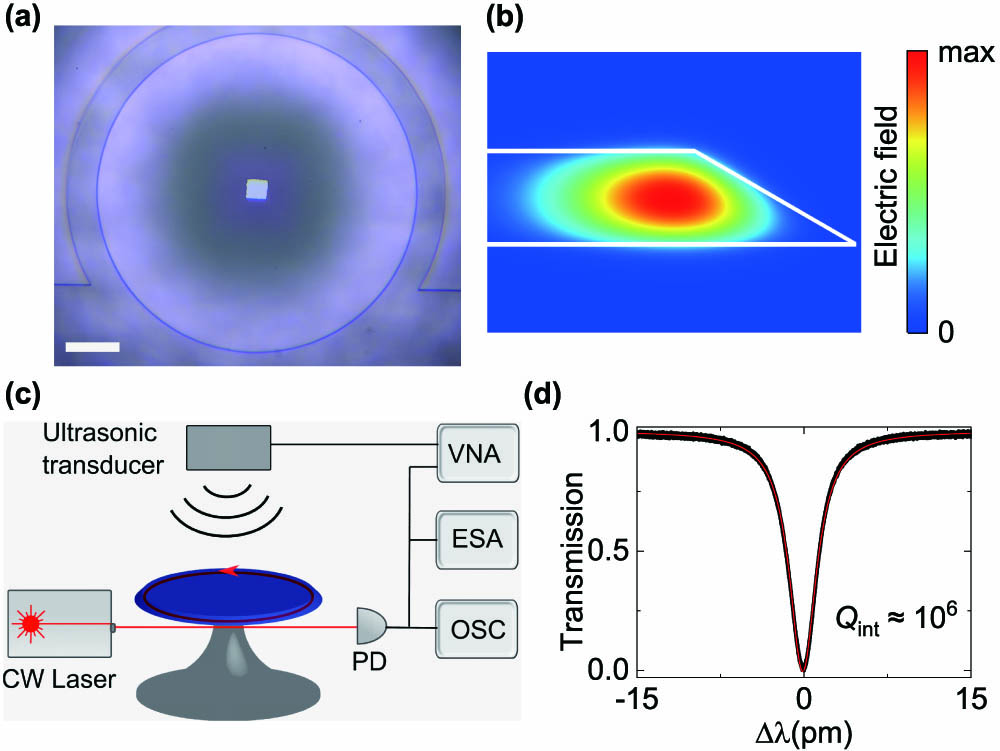
    Fig. 2. (a) Top-view optical microscope image of a microdisk with a trench structure. The scale bar corresponds to 50 μm. (b) FEM simulated optical field distribution of the fundamental WGM of the microdisk. (c) Experimental setup to measure the microdisk response to ultrasound. PD, photodetector; VNA, vector network analyzer; OSC, oscilloscope; ESA, electronic spectrum analyzer. (d) Optical transmission spectrum of the microdisk, with an intrinsic Q factor of around 106.
    (a) Noise power spectrum (black curve) and the response of the microdisk (green curve) driven by ultrasound at 83 kHz, with an SNR of 58.73 dB. (b) System response of the microdisk versus the ultrasound frequency. The inset shows the simulated displacement distributions of the high-order flapping modes. (c) Derived ultrasound sensitivity spectrum of the microdisk.
    Fig. 3. (a) Noise power spectrum (black curve) and the response of the microdisk (green curve) driven by ultrasound at 83 kHz, with an SNR of 58.73 dB. (b) System response of the microdisk versus the ultrasound frequency. The inset shows the simulated displacement distributions of the high-order flapping modes. (c) Derived ultrasound sensitivity spectrum of the microdisk.
    (a), (b) Sensitivity spectra for 1 μm thick microdisks with different radii. (c)–(e) Sensitivity spectra for 2 μm thick microdisks with different radii. The blue, red, black, green, and purple curves represent the sensitivities of microdisks with radii of 100 μm, 150 μm, 200 μm, 300 μm, and 400 μm, respectively. The shaded regions emphasize the (a), (c) first-order and (b), (d), (e) second-order flapping modes.
    Fig. 4. (a), (b) Sensitivity spectra for 1 μm thick microdisks with different radii. (c)–(e) Sensitivity spectra for 2 μm thick microdisks with different radii. The blue, red, black, green, and purple curves represent the sensitivities of microdisks with radii of 100 μm, 150 μm, 200 μm, 300 μm, and 400 μm, respectively. The shaded regions emphasize the (a), (c) first-order and (b), (d), (e) second-order flapping modes.
    Sensitivities at the flapping modes of microdisks with different thicknesses and radii. The black squares and blue triangles represent the sensitivities at the first-order flapping mode for thicknesses of 1 μm and 2 μm, respectively. The red circles and green inverted triangles represent sensitivities at the second-order flapping mode for thicknesses of 1 μm and 2 μm, respectively. The purple rhombus and yellow pentagram represent sensitivities at the first- and second-order flapping modes for a microdisk with a thickness of 2 μm and a radius of 100 μm, and without the trench structure.
    Fig. 5. Sensitivities at the flapping modes of microdisks with different thicknesses and radii. The black squares and blue triangles represent the sensitivities at the first-order flapping mode for thicknesses of 1 μm and 2 μm, respectively. The red circles and green inverted triangles represent sensitivities at the second-order flapping mode for thicknesses of 1 μm and 2 μm, respectively. The purple rhombus and yellow pentagram represent sensitivities at the first- and second-order flapping modes for a microdisk with a thickness of 2 μm and a radius of 100 μm, and without the trench structure.
    StructureQ FactorSensitivity (μPaHz1/2)References
    Microsphere>108267[9]
    Microsphere1061.29×103[10]
    Microring1041.3×103[16]
    Microbubble10741×103[17]
    Microbubble3×1074.4×103[19]
    Microbubble5.2×1052.2×103[20]
    Microdisk3.6×1068–300[21]
    Microtoroid10746–10,000[22]
    Microdisk (this work)1061.18
    Table 1. Comparison of WGM Microcavity Ultrasound Sensors
    Hao Yang, Xuening Cao, Zhi-Gang Hu, Yimeng Gao, Yuechen Lei, Min Wang, Zhanchun Zuo, Xiulai Xu, Bei-Bei Li. Micropascal-sensitivity ultrasound sensors based on optical microcavities[J]. Photonics Research, 2023, 11(7): 1139
    Download Citation