Author Affiliations
1School of Computer Engineering, Nanjing Institute of Technology, Nanjing 211167, China2School of Physics and Telecommunication Engineering, Shaanxi University of Technology, Hanzhong 723000, China3School of Information and Communications Engineering, Xi’an Jiaotong University, Xi’an 710049, Chinashow less
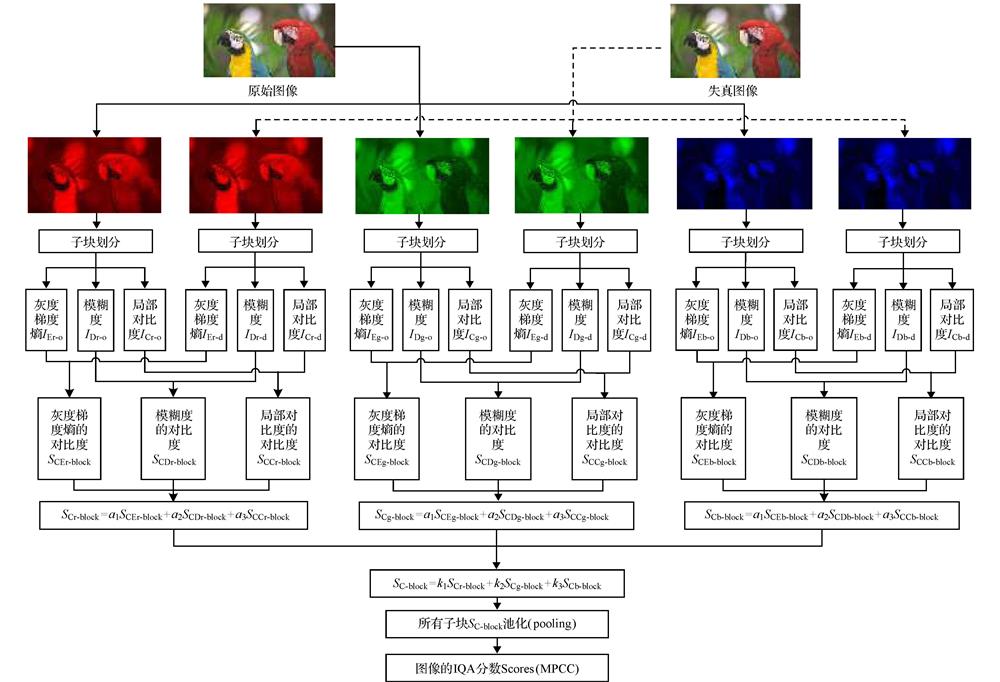
Fig. 1. The architecture of the proposed IQA method.
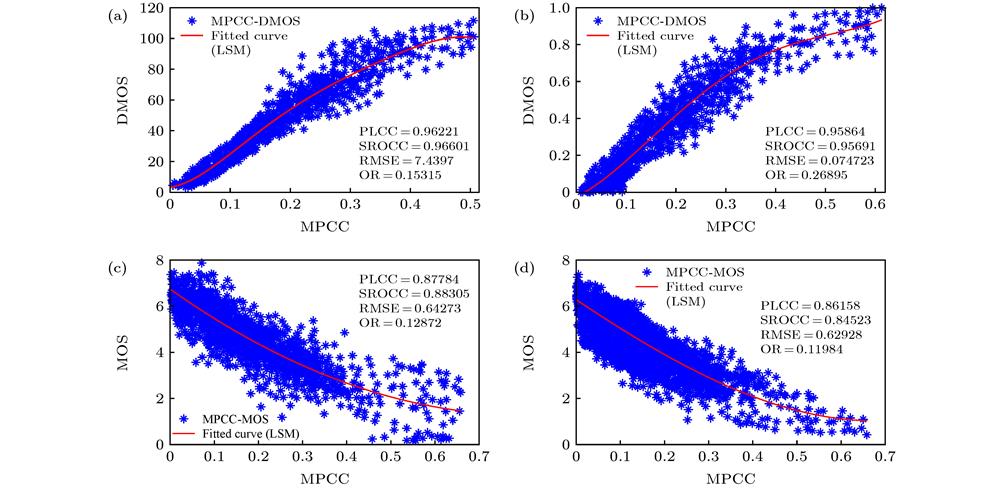
Fig. 2. Scatter plots between the subjective and objective IQA results of images in four databases: (a) LIVE; (b) CSIQ; (c) TID2008; (d) TID2013
Fig. 3. IQA results of the gray and monochrome images in IVC database by the proposed model.
Fig. 4. Comparing the accuracy of the proposed model with those of the existing 7 models based on the IQA results in TID2008 database: (a) PSNR-TID2008; (b) VSNR-TID2008; (c) SSIM-TID2008; (d) FSIMc-TID2008; (e) VSI-TID2008; (f) GMSD-TID2008; (g) MAD-TID2008; (h) MPCC-TID2008.
Fig. 5. Comparison of the complexity of 8 IQA models based on the IQA running time per 10 images.
Fig. 6. Accuracy comparisons among 8 IQA metrics based on PLCC of IQA results from 28 types of distortion images in three databases: (a) CSIQ; (b) LIVE; (c) TID2008.
Fig. 7. Scatter plots of the IQA results of 6 kinds of distorted images in CSIQ database evaluating by the proposed IQA model: (a) awgn; (b) jpeg; (c) jpeg2k; (d) fnoise; (e) blur; (f) contrast.
Fig. 8. Scatter plots of the IQA results of 5 kinds of distorted images in LIVE database evaluating by the proposed IQA model: (a) jpeg2k; (b) jpeg; (c) WN; (d) gblur; (e) fastfading.
Fig. 9. Scatter plots of the IQA results of 17 kinds of distorted images in TID2008 database evaluating by the proposed IQA model: (a) AGN; (b) ANCC; (c) SCN; (d) MN; (e) HFN; (f) IN; (g) QN; (h) GB; (i) ID; (j) JPEG; (k) JPEG2k; (l) JPEGtrans; (m) JPEG2ktrans; (n) NEPN; (o) LBWD; (p) MS; (q) CC.
Fig. 10. Scatter plots of the IQA results of 24 kinds of distorted images in TID2013 database evaluating by the proposed IQA model: (a) AGN; (b) NCC; (c) SCN; (d) MN; (e) HFN; (f) IN; (g) QN; (h) GB; (i) ID; (j) JPEG; (k) JPEG2k; (l) JPEGtrans; (m) JPEG2ktrans; (n) NEPN; (o) LBWD; (p) MS; (q) CC; (r) CCS; (s) MGN; (t) CN; (u) LCN; (v) CQWD; (w) CA; (x) SSR.
| 数据库 | LIVE(779) | CSIQ(866) | TID2008(1700) | TID2013(3000) | 加权 | | PLCC | 0.9622 | 0.9586 | 0.8778 | 0.8616 | 0.8915 | | SROCC | 0.9660 | 0.9569 | 0.8831 | 0.8452 | 0.8854 | | RMSE | 7.4397 | 0.0747 | 0.6427 | 0.6293 | — | | OR | 0.1531 | 0.2690 | 0.1287 | 0.1198 | — |
|
Table 1. Calculated 4 correlation parameters between the subjective and objective IQA scores of images in 4 databases.
| 数据库 | 参数 | PSNR | VSNR | SSIM | FSIMc | VSI | GMSD | MAD | MPCC | | CSIQ | PLCC | 0.8000 | 0.8002 | 0.8613 | 0.9192 | 0.9279 | 0.9541 | 0.9502 | 0.9587 | | SROCC | 0.8058 | 0.8106 | 0.8756 | 0.9310 | 0.9423 | 0.9570 | 0.9466 | 0.9569 | | RMSE | 0.1575 | 0.1575 | 0.1334 | 0.1034 | 0.0979 | 0.0786 | 0.0818 | 0.0748 | | OR | 0.4220 | 0.3832 | 0.3535 | 0.3041 | 0.2873 | 0.2742 | 0.2829 | 0.2738 | | LIVE | PLCC | 0.8723 | 0.9231 | 0.9449 | 0.9613 | 0.9482 | 0.9603 | 0.9675 | 0.9620 | | SROCC | 0.8756 | 0.9274 | 0.9479 | 0.9645 | 0.9524 | 0.9603 | 0.9669 | 0.9660 | | RMSE | 13.3597 | 10.5059 | 8.9455 | 7.5296 | 8.6816 | 7.6214 | 6.9073 | 7.4598 | | OR | 0.2179 | 0.2151 | 0.1865 | 0.1627 | 0.1853 | 0.1643 | 0.1529 | 0.1606 | | TID2013 | PLCC | 0.7062 | 0.7402 | 0.7895 | 0.8769 | 0.9000 | 0.8553 | 0.8267 | 0.8648 | | SROCC | 0.6917 | 0.7316 | 0.7417 | 0.8510 | 0.8965 | 0.8044 | 0.7807 | 0.8452 | | RMSE | 0.8887 | 0.8392 | 0.7608 | 0.5959 | 0.5404 | 0.6423 | 0.6975 | 0.6224 | | OR | 0.1636 | 0.1552 | 0.1427 | 0.1132 | 0.1045 | 0.1242 | 0.1323 | 0.1179 |
|
Table 2. Comparing the accuracy of the proposed model with those of the existing 7 models based on the IQA results in CSIQ, LIVE, and TID2013 databases.
基于CSIQ, LIVE和TID2013数据库中的图像IQA结果比较所提模型与现有7个模型的精度
| 失真类别 | PSNR | VSNR | SSIM | FSIMc | VSI | GMSD | MAD | MPCC | | 1 Additive Gaussian noise(AGN) | 0.9552 | 0.8319 | 0.8685 | 0.9152 | 0.9527 | 0.9503 | 0.8897 | 0.8706 | | 2 Noise in color comp. (NCC) | 0.9256 | 0.7814 | 0.8050 | 0.8873 | 0.9172 | 0.9118 | 0.8438 | 0.8324 | | 3 Spatially correl. noise (SCN) | 0.9525 | 0.8105 | 0.8621 | 0.8989 | 0.9472 | 0.9391 | 0.9008 | 0.7457 | | 4 Masked noise (MN) | 0.8707 | 0.7715 | 0.8219 | 0.8492 | 0.8203 | 0.7547 | 0.8009 | 0.6943 | | 5 High frequency noise (HFN) | 0.9731 | 0.9061 | 0.9081 | 0.9475 | 0.9655 | 0.9567 | 0.9233 | 0.9090 | | 6 Impulse noise (IN) | 0.8887 | 0.7442 | 0.7415 | 0.8171 | 0.8635 | 0.7572 | 0.3206 | 0.7408 | | 7 Quantization noise (QN) | 0.8880 | 0.8384 | 0.8702 | 0.8794 | 0.8747 | 0.9110 | 0.8571 | 0.8122 | | 8 Gaussian blur (GB) | 0.9169 | 0.9437 | 0.9634 | 0.9544 | 0.9551 | 0.9099 | 0.9357 | 0.9252 | | 9 Image denoising (ID) | 0.9640 | 0.9463 | 0.9589 | 0.9652 | 0.9707 | 0.9759 | 0.9645 | 0.9594 | | 10 JPEG compression (JPEG) | 0.9167 | 0.9386 | 0.9551 | 0.9754 | 0.9858 | 0.9843 | 0.9638 | 0.9509 | | 11 JPEG2000 compression (JPEG2 K) | 0.9170 | 0.9513 | 0.9658 | 0.9754 | 0.9845 | 0.9812 | 0.9740 | 0.9452 | | 12 JPEG transm. errors (JPEG trans.) | 0.8104 | 0.8597 | 0.9181 | 0.9176 | 0.9457 | 0.9079 | 0.9001 | 0.8805 | | 13 JPEG2000 transm. errors (JPEG2K trans) | 0.9002 | 0.8435 | 0.8801 | 0.8929 | 0.9192 | 0.9085 | 0.8838 | 0.8699 | | 14 Non ecc. patt. noise (NEPN) | 0.6746 | 0.6774 | 0.7773 | 0.8068 | 0.8162 | 0.8133 | 0.8608 | 0.8132 | | 15 Local block-wise dist. (LBWD) | 0.2410 | 0.3632 | 0.6022 | 0.5542 | 0.4984 | 0.6520 | 0.4187 | 0.6845 | | 16 Mean shift (MS) | 0.8056 | 0.5160 | 0.8019 | 0.7869 | 0.8021 | 0.7707 | 0.6934 | 0.7720 | | 17 Contrast change (CC) | 0.5811 | 0.4251 | 0.6026 | 0.7266 | 0.6974 | 0.7111 | 0.3199 | 0.8108 | | 18 Change of color saturation (CSS) | 0.3294 | 0.4184 | 0.4590 | 0.8228 | 0.8052 | 0.4234 | 0.2846 | 0.7583 | | 19 Multipl. Gauss. noise (MGN) | 0.9204 | 0.7730 | 0.7896 | 0.8660 | 0.9136 | 0.8911 | 0.8529 | 0.8759 | | 20 Comfort noise (CN) | 0.8702 | 0.9016 | 0.9022 | 0.9463 | 0.9546 | 0.9562 | 0.9444 | 0.8476 | | 21 Lossy compr. of noisy (LCN) | 0.9429 | 0.8960 | 0.9174 | 0.9564 | 0.9636 | 0.9703 | 0.9562 | 0.7889 | | 22 Image color quant. w. dither (CQWD) | 0.9308 | 0.8773 | 0.8619 | 0.8911 | 0.8963 | 0.9192 | 0.8779 | 0.8721 | | 23 Chromatic aberrations (CA) | 0.9556 | 0.9592 | 0.9770 | 0.9794 | 0.9748 | 0.9737 | 0.9696 | 0.9473 | | 24 Sparse sampl. and reconstr. (SSR) | 0.9296 | 0.9477 | 0.9667 | 0.9776 | 0.9808 | 0.9849 | 0.9766 | 0.9349 | | Max | 0.9731 | 0.9592 | 0.9770 | 0.9794 | 0.9858 | 0.9849 | 0.9766 | 0.9594 | | Min | 0.2410 | 0.3632 | 0.4590 | 0.5542 | 0.4984 | 0.4234 | 0.2846 | 0.6845 | | 波动范围宽度 | 0.7321 | 0.5959 | 0.5181 | 0.4252 | 0.4873 | 0.5614 | 0.6920 | 0.2750 | | 所有整体精度 | 0.7062 | 0.7402 | 0.7895 | 0.8769 | 0.9000 | 0.8553 | 0.8267 | 0.8648 |
|
Table 3. [in Chinese]