This work proposes a method to concurrently calibrate multiple acoustic speeds in different mediums with a photoacoustic (PA) and ultrasound (US) dual-modality imaging system. First, physical infrastructure information of the target is acquired through a US image. Then, we repeatedly build PA images around a special target to yield the best focused result by dynamically updating the acoustic speeds in a different medium of the target. With these correct acoustic propagation velocities in the according mediums, we can effectively optimize the PA image quality as the experiments proved, which might benefit future research in biomedical imaging science.
The speed of sound (SOS) in biomedical tissues typically used is 1540 m/s despite the fact that in soft tissues this property is known to range from approximately 1450 m/s in fat to over 1600 m/s in muscle[1]. These 5% SOS errors will significantly reduce the contrast and spatial resolution of the photoacoustic tomography (PAT) image[2]. Acoustic speed variations have two effects on PAT images. The first effect is the displacement of the photoacoustic (PA) signal radially. The second one is the displacement of PA signals tangentially due to the ultrasonic refraction away from the assumed straight path. Existing PA image reconstruction methods back project the acquired acoustic signals from a given viewing angle to the imaging region without a position correction[3,4]. Therefore, the back projected signals from a given detector are misplaced in the reconstructed image and subsequently added imprecisely to the back projected signals obtained from other detectors. This causes both blurring and displacement in the reconstructed image and reduces the contrast[5,6]. A well-focused PA image must come along with the correct SOS.
Researchers proposed methods to deal with this SOS issue by post imaging compensation or using a better mean acoustic sound speed[7–9]. He extended the methods of choosing the range size by calculating the spatial frequency contents[10]. Treeby proposed works by re-transmitting the measured acoustic pressure signals into the domain in time-reversed order[11]. Wang developed and investigated a waveform inversion with source encoding (WISE) method for breast imaging with a circular transducer array[12]. Huang developed and investigated a discrete imaging model for photoacoustic computed tomography (PACT) that is based on the exact PA wave equation and facilitates the circumvention of these limitations, which can mitigate the effects of data incompleteness and noise[13]. In this study, based on a PA and ultrasound (US) dual-modality imaging system[14–16], we present an adaptive method to correct SOS so as to build better focused PA images. Compared with other methods, our method can provide a different SOS for different tissue areas to improve image quality. Our method can also be adopted in improving image quality in US imaging, which will be included in our future studies.
PA imaging and sensing is an emerging hybrid technology involving both light and sound with excellent sensitivity to the chemical and physiological information in biological samples and has been explored for potential application in the diagnosis of osteoporosis, breast cancer, arthritis, and other relevant diseases. Research on PAT saw increased development for its promising characteristics with non-invasive and non-ionizing disease diagnosing[1–3]. Reconstruction of a PA image is an inverse problem to calculate the pressure of the source according to the pressure measured by a moving transducer or array of transducers. The pressure at position and time , stimulated by a heat source , in an acoustically homogeneous liquid-like medium obeys the following wave equation[1]: where is a heating function, is the isobaric volume expansion coefficient, is the specific heat, and is the SOS. Under stress confinement, which occurs when the laser pulse width is much shorter than the tissue stress relaxation time, the solution to Eq. (1) in the time domain can be expressed by where is the initial PA pressure. To solve the inverse problem of Eq. (2) and obtain , the back-propagation (BP) reconstruction algorithm[17,18] can be adopted to yield where is the solid angle subtended by the entire surface with respect to the reconstruction point , and is the vector of the transducer element.
Sign up for Chinese Optics Letters TOC. Get the latest issue of Chinese Optics Letters delivered right to you!Sign up now
The travel time of PA waves is determined by the SOS in biological tissue and the propagation distance. It can be given by the integral of the inverse of the acoustic speed in the tissue along the propagation path where is the acoustic speed in the tissue, and is the propagation path. The total travel time can be measured from the recorded PA signals. With our dual-modality imaging system, we are able to get both a US image and a PA image simultaneously. In our study, we first get the infrastructure from US image as prior information. By assigning a different SOS for each tissue area, the sound propagation path and travel time can be segmented as where is the full propagation path, is the number of different tissue for a full acoustic wave propagation, and is the SOS in each tissue.
The purpose of this study is to correct the SOS through yielding a best focused PA image[19–21]. By assuming the average SOS for each as the initial value, these acoustic wave speeds are recursively and adaptively updated under the correction criterion[22]. When each SOS converges to the correct value, the PA image will show focused details in all scopes of view[23,24]. Otherwise, certain details in the PA image will blur due to the deviation of the SOS. Three quality assessment criterion, the energy summation of the strongest optical absorb source (as described in Eq. (6)), the energy convergence degree among strongest optical absorb source (as described in Eq. (7)), and the energy gradient of the strongest optical absorb source (as described in Eq. (8)), are adaptively selected in our SOS correction procedure. where is the image pixel of the strongest optical absorption source, is the image pixel around the strongest optical absorbtion source, is the number of the strongest optical absorption sources, and is the image pixel number around each of the strongest optical absorption source. Thus, the PA image reconstruction procedure in Eq. (3) can be realized by where is the end position of the -th part of the propagation path.
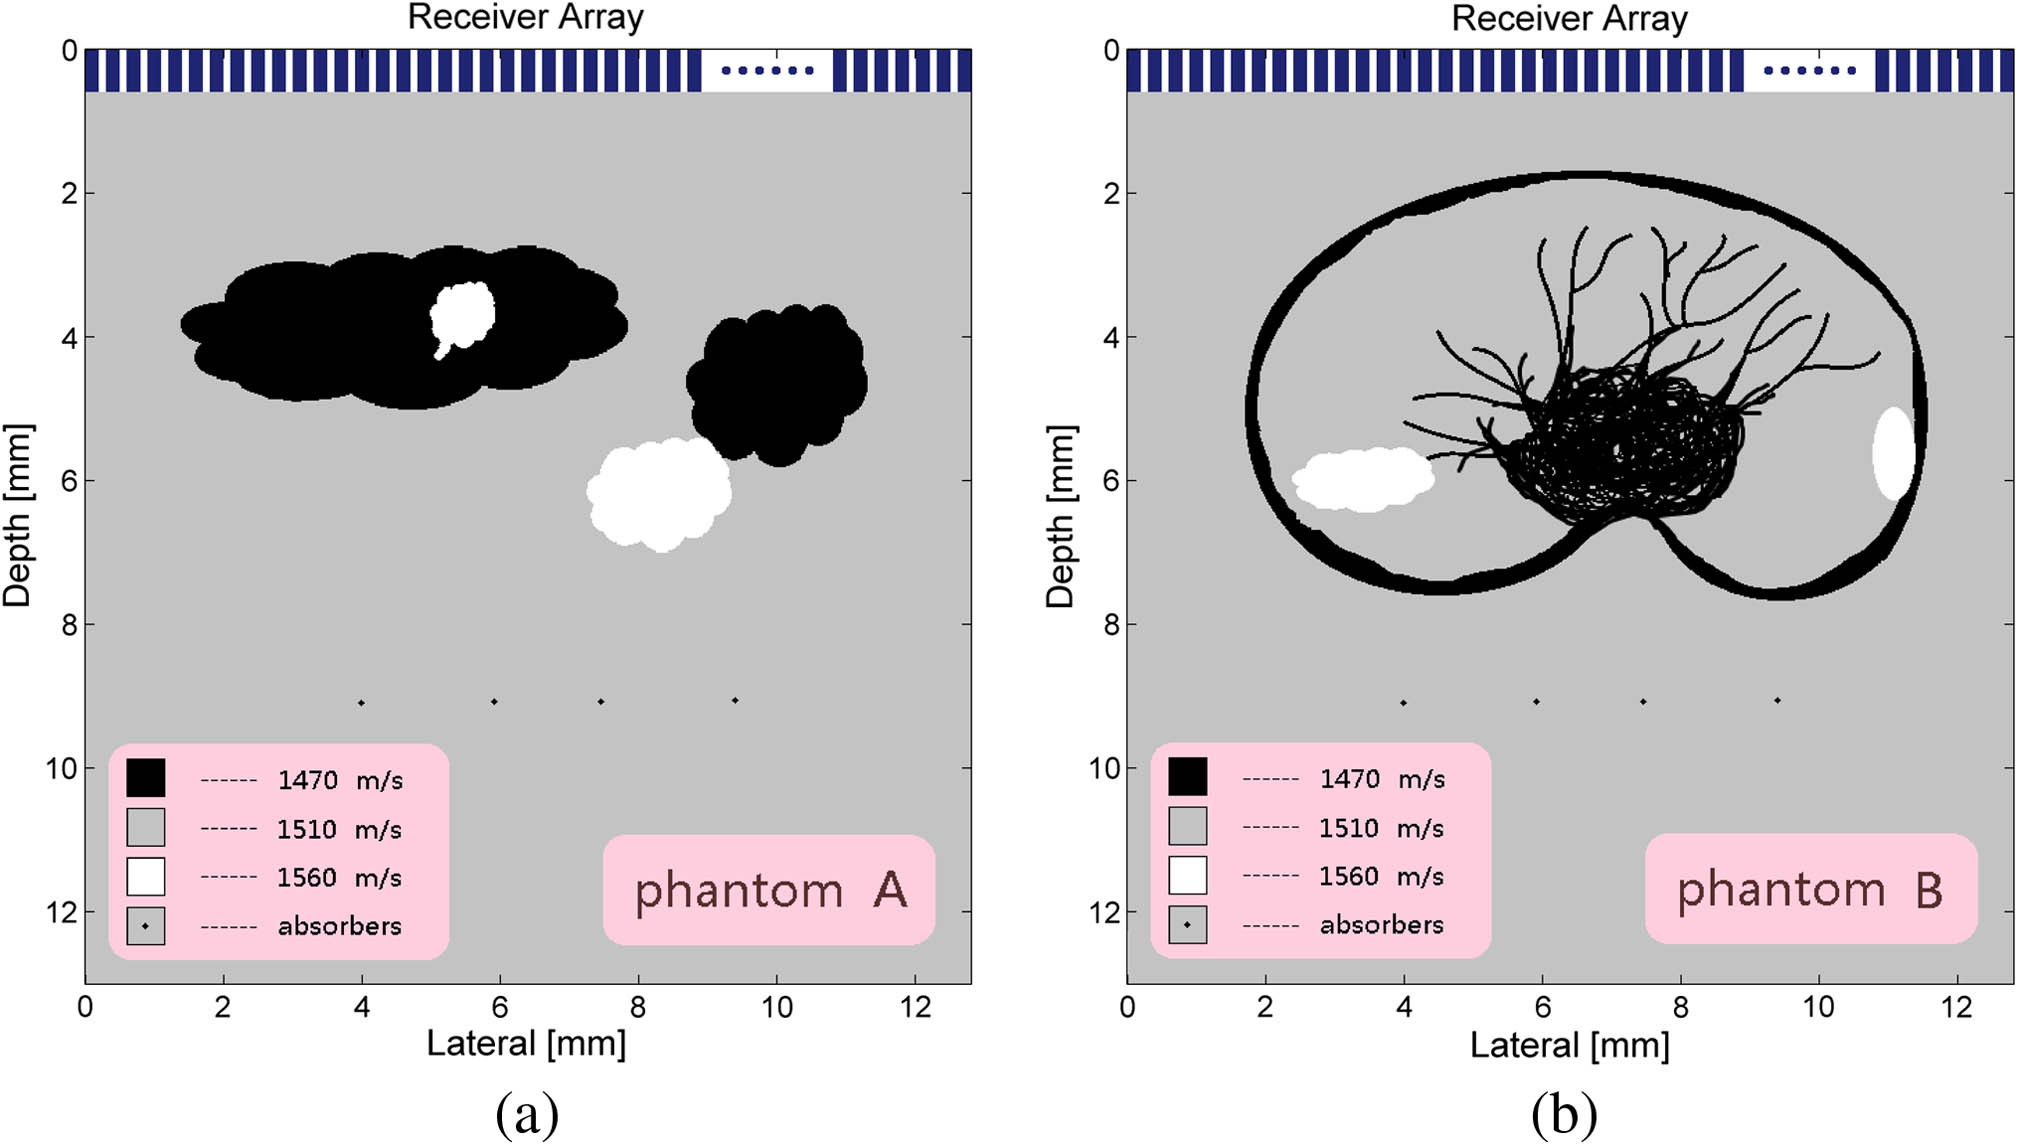
Our simulation experiments using the k-wave software package are conducted on phantom A and phantom B (as shown in Figs. 1(a) and 1(b)). Different gray levels denote different acoustic speed tissue areas. In phantom A and B, the acoustic trans-receiver array has 128 elements, and the pitch between adjacent elements is 0.1 mm. The dimensions of these two phantoms are 14 mm of length times 12.8 mm of width. Four optical absorbers are buried in the depth at 9.5 mm and in the lateral at 4.0, 6.0, 7.5, and 9.0 mm, respectively.
In both simulation experiments, three different SOSs are assigned for the different tissue areas of the phantom. By assuming a pulse laser illuminated on the four optical absorbers, the PA data can be acquired by the trans-receiver array above the phantom. Next, we assign an identical initial SOS (1540 m/s) for each tissue area and build a PA image using Eq. (10). Since obviously SOS differences exist, this PA image will inevitably show unfocused details around the four optical absorbers. Then, by adaptively selecting quality assessment criterion (as mentioned previously by Eqs. (6), (7), and (8)) and repeatedly building PA images with an updated SOS, the PA image will progressively express better focused information around the four optical absorbers, and the acoustic propagation speeds in each tissue area will converge to their ground truth results. Within the estimated range, we set up five different SOSs searching step-lengths (50, 20, 5, 2, and 0.5 m/s). For each searching step-length, all three assessment criterion are calculated, and the one that gets the most progressive improvement is chosen. For the simulation phantom A and B, the initial PA image and final focused PA image are shown in Figs. 2(a) and 2(b), the error rate of the SOS versus the searching step-length are shown in Fig. 2(c).
Figure 2.Error rate of SOS versus searching step-length.
The final calculation results of phantom A and B with this method are shown in Table 1. The maximum error of the selected SOS with the correct value is less than 2% in our simulation experiments.
The result of the reconstructed image with the correct SOS is compared with the calculated SOS (phantom A as shown in Figs. 3(a) and 3(b) and phantom B as shown in Figs. 3(c) and 3(d)). We can hardly find the differences.
As the schematic shows in Figs. 4(a) and 4(b), our ex vivo experimental setup includes an optical parametric oscillator (OPO) system (Phocus Mobile, Opotek, USA) pumped by an Nd:YAG laser (Brilliant B, Bigsky, USA) to provide laser pulses with a repetition rate of 10 Hz and a pulse width of 5.5 ns. The US transducer probe (L7-4 45 mm width, 0.298 mm element pitch, 128 elements, and 5 MHz center frequency, Philips) is used as the acoustic trans-receiver array. The US probe emits acoustic signals at the falling edge of a square wave which is triggered by an US imaging system (Clever Series, Wisonic, China). The laser (tuned to a 720 nm wavelength) is triggered by the Wisonic system at the rising edge of a square wave and guided by fibers to irradiate on the four optical absorbers.
As shown in Figs. 4(c) and 4(d), the actual phantom in the experiment is made of pork muscle and fat, four pencil beads with a 0.7 mm diameter, and the gelatin produced from pigskin powder. The water tank is filled with 15% gelatin (the SOSs is around 1540 m/s at 20°C). Two layers of the fat and muscle of pork blocks (the SOSs in the fat and muscle of pork are around 1400–1478 and 1568–1600 m/s, respectively[25–27]) are placed in the gelatin bulk. Four carbon granules, which are characterized as a good optical absorbing property, are placed under the pork and fat layers. The height of each layer of the pork is 2–3 mm, the distance of pencil beads to the ultrasonic trans-receiver is about 20 mm, and the distance between pencil beads is 8 m; the incident angle of laser is about 75° in the horizontal direction. In our experiment, the ex vivo phantom is designed to mimic a breast. A breast is comprised mostly of the breast glands, ducts, adipose tissue, and fibrous tissue. The muscle in our phantom corresponds to the breast cancer tissue, and the fat corresponds to the connective tissue. On this phantom, we conducted PA and US dual-modality imaging experiments to acquire the PA signals and US images. The pulse laser beam only illuminates on the area that covers the four pencil beads. With the US images (as shown in Figs. 5(a) and 5(b)) which display the whole phantom area, we can measure the position and size of each tissue. When using one unified acoustic speed for the image reconstruction, the deviation of the propagation time will degrade both the US image and the PA image (as shown in Figs. 5(a) and 5(b)). It clearly shows that the influence of the fat layer on the image quality is greater than that of the muscle layer. Both the axial and lateral resolutions are degraded in both the US images and the PA images. With our proposed method, we can calibrate the acoustic propagation speed to their ground truth values in different tissue areas. In this ex vivo experiment, the SOSs in gelatin, fat, and muscle of pork are converged to 1538.5, 1451, and 1591.5 m/s, respectively. We expose the laser beam on the whole phantom and build the PA image with a unified SOS (as shown in Figs. 5(c) and 5(d)) to compare to the PA image building with the correct SOS in each tissue (as shown in Figs. 5(e) and 5(f)). The upper and lower contours of the muscle and fat are better imaged when using a calibrated SOS as expected.
Figure 5.Ex vivo experiment results and comparisons.
In our ex vivo experiment, since we do not have the ground truth value of the correct SOS in each tissue, the comparison cannot be made. However, through a large number of simulations (different infra-structures and different propagation SOS), both the error of the SOS and the difference between the imaging results were very small while comparing the correct SOS with the calculated SOS. As a result, we can form the conclusion that the imaging results with the calibration SOS will be close to the results with the correct SOS with our proposed method. The in vivo studies on acoustically heterogeneous tissue with our method are limited because of the complex infra-structure. But for the region of interest, we can yield better imaging results with our proposed method for image optimization.
In this study, based on our dual-modality imaging system, we propose an adaptive method to calibrate the acoustic propagation speed in different biomedical tissue through the quality assessment of PA images. With the correct SOS, we can reconstruct PA images with better image quality. The method proposed in this study can also be helpful for other sound based imaging research such as US imaging and SOS imaging, which will be our interest in future studies.
References
[1] M. Xu, L. V. Wang. Rev. Sci. Instrum., 77, 22(2006).