
Le Wang, Yue Fang, Shengchun Wang, Hao Wang, Guoqing Li, Shengwei Ren, Peng Dai, Qiaofeng Tan. Research on the Simulation Model of Rail Profile Measurement System Based on Zemax[J]. Chinese Journal of Lasers, 2021, 48(16): 1604004
- Chinese Journal of Lasers
- Vol. 48, Issue 16, 1604004 (2021)
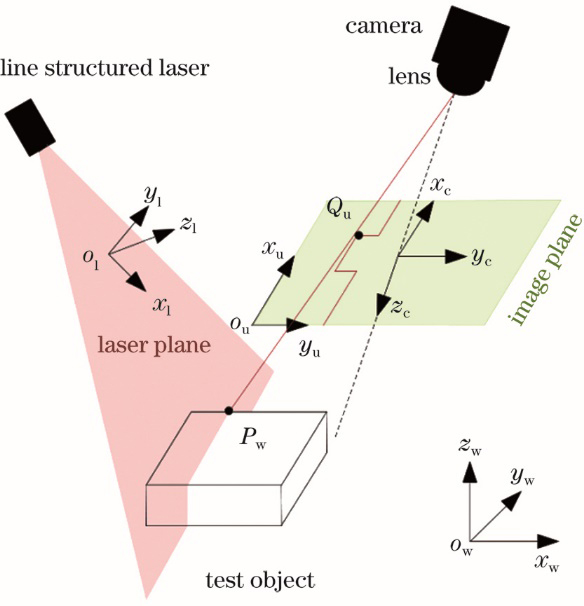
Fig. 1. Geometric model of line structured light perspective projection
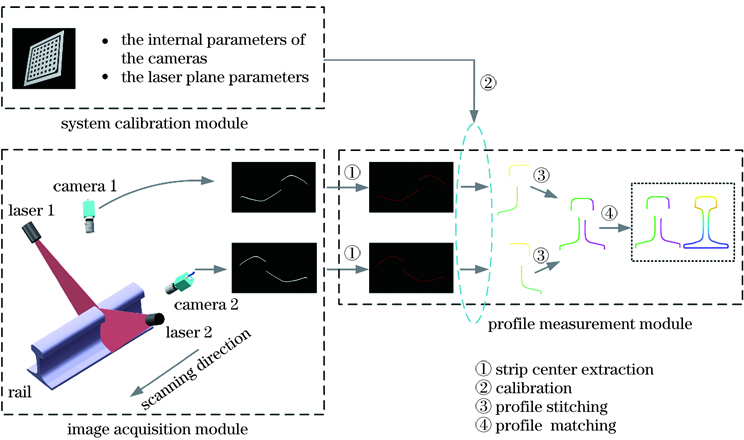
Fig. 2. Schematic diagram of rail profile measurement system with line structured light
Fig. 3. Modeling flow chart of rail profile measurement system
Fig. 4. Line laser. (a) Physical picture; (b)--(d) simulation model
Fig. 5. Original lens model in sequence model
Fig. 6. Lens and camera. (a) Physical picture; (b) optical model
Fig. 7. Standard 60 kg/m rail. (a) Main parameters of cross section; (b) optical model
Fig. 8. Line structured light profile measurement component. (a) Main optical structure parameters; (b) optical simulation model of component
Fig. 9. Simulation model of rail profile measurement system
Fig. 10. System calibration module modeling. (a) Calibration target; (b) optical model of calibration target; (c) calibration of camera internal parameters; (d) calibration of laser plane
Fig. 11. Schematic diagram of laser plane calibration
Fig. 12. Flow chart of control program of profile measurement module
Fig. 13. Partial images collected by the simulation model for camera internal parameter calibration. (a) Left camera; (b) right camera
Fig. 14. Images collected by the simulation model for laser plane calibration. (a) Left camera; (b) right camera
Fig. 15. Component accuracy verification experiment. (a) Gauge block model; (b) measuring device of simulation; (c) laser cross section image of gauge block; (d) measurement result of gauge block
Fig. 16. Simulation measurement experiment of rail profile. (a) Model of worn rail; (b) simulation measuring device; (c)(d) image of laser cross section on left and right side of rail; (e) profile measurement result
Fig. 17. Practical measurement experiment of rail profile. (a) Worn rail; (b) experimental device; (c)(d) image of laser cross section on left and right side of rail; (e) profile measurement result
Fig. 18. Measurement results of rail vertical wear based on actual measurement system and simulation model
Fig. 19. Cross section energy distribution of line structured light. (a)(b) Actual situation; (c)(d) simulation model
Fig. 20. Rail strip and rough surface ( Ra=100 μm )
|
Table 1. Main parameters of line laser
|
Table 2. Main parameters of camera
| ||||||||||||||||||||||||||||||||||||||||||||||||||||||||||||
Table 3. Calibration results of system simulation model
|
Table 4. Depth measurement error of simulation model of line structured light profile measurement component
| ||||||||||||||
Table 5. Statistical results of rail wear measurement unit: mm

Set citation alerts for the article
Please enter your email address
© Copyright 2018-2021 | Chinese Laser Press. All Rights Reserved 沪ICP备15018463号-20