
Ming Gao, Yong-He Deng, Da-Dong Wen, Ze-An Tian, He-Ping Zhao, Ping Peng. Evolution characteristics and hereditary mechanisms of clusters in rapidly solidified Pd82Si18 alloy [J]. Acta Physica Sinica, 2020, 69(4): 046401-1
- Acta Physica Sinica
- Vol. 69, Issue 4, 046401-1 (2020)
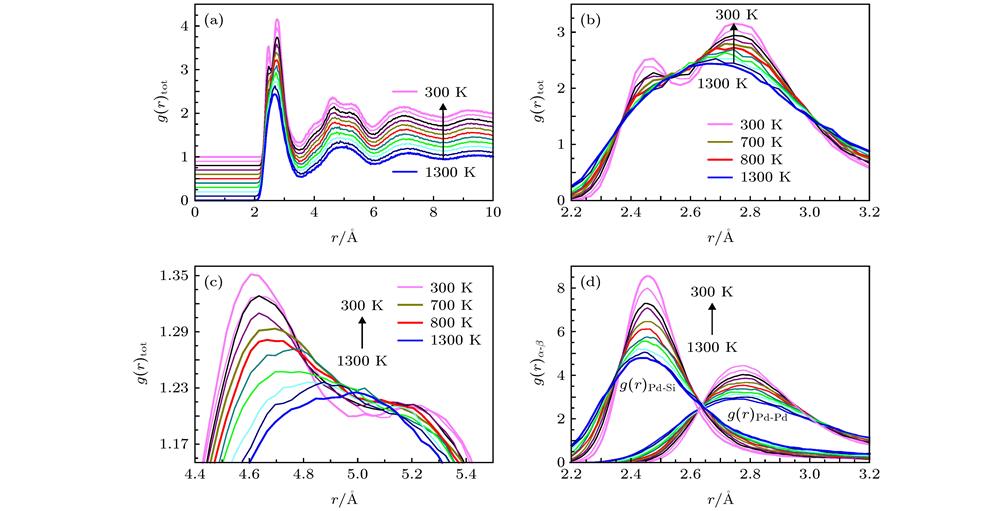
Fig. 1. Pair distribution functions g (r ) for rapidly solidified of Pd82Si18 from 1300 to 300 K (Δ T =100 K): (a) The g (r )tot curve; (b) first peak zoom of g (r )tot curve; (c) second peak zoom of g (r )tot curve; (d) first peak zoom of g (r )Pd-Si and g (r )Pd-Pd curve.
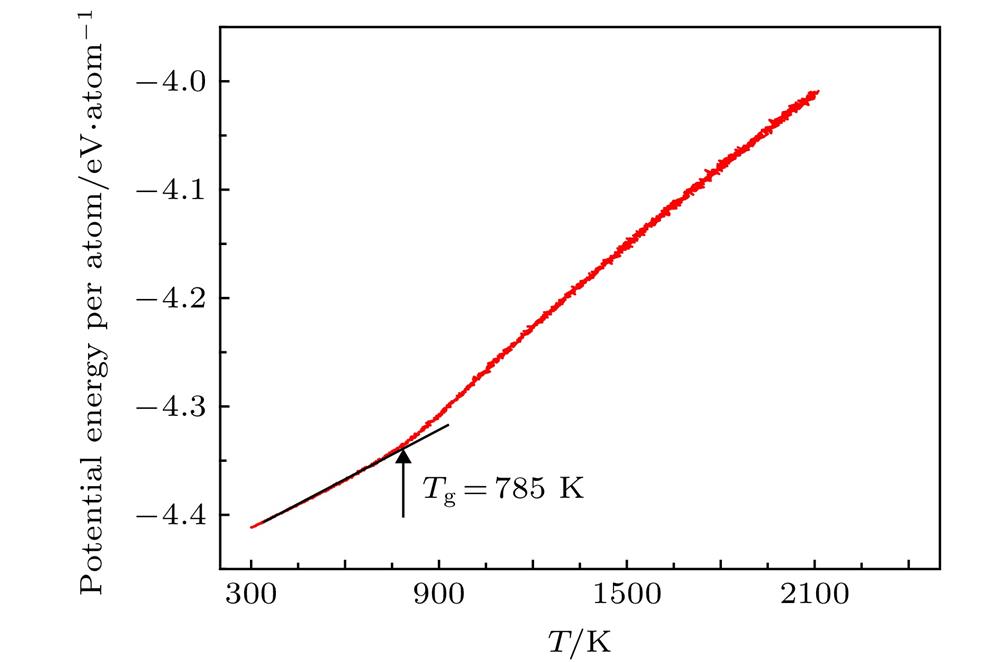
Fig. 2. Average atomic potential energy of per atom in the simulated system as a function of temperature T during rapid solidification.
Fig. 3. Schematic diagram of BSAP and TTP with CTIM index of (10 2/1441 8/1551) and (9 3/1441 6/1551) (Red ball denote Si atom and gray balls denote Pd atoms).
Fig. 4. The temperature dependence of the number of typical basic clusters in Pd82Si18 alloys: (a) Canonical Kasper clusters; (b) distorted Kasper clusters.
Fig. 5. Basic cluster heredity schematic map of BSAP: (a) Perfect heredity; (b) core heredity
Fig. 6. The heredity fractions in amorphous alloy Pd82Si18 from 810 K to 300 K.
Fig. 7. Binding energies of several basic Si-centered clusters of amorphous alloy Pd82Si18 at 810 and 300 K depend on the distribution of clusters: (a) Binding energy distribution of basic Si-centered clusters at 800 K; (B) binding energy distribution of basic Si-centered clusters at 300 K; (c) distribution of average binding energy of basic Si-centered clusters at 800 and 300 K.
Fig. 8. Binding energies of several optimized basic Si-centered clusters depend on the distribution of clusters: (a) EAM calculations; (b) first-principle calculations.
Fig. 9. Pattern of local charge density distribution: (a) Local charge density of Si-centered Pd10Si cluster; (b) local charge density of Si-centered Pd9Si cluster(White and red fonts in the figure represents atoms on the tangent plane).
Fig. 10. The density of states (DOS) diagrams of optimized basic Si-centered clusters: (a) The DOS of Pd9Si、Pd10Si and Pd11Si clusters; (b) zoom of the Fermi level in (a) diagram.
| ||||||||||||||||||||||||||||||||||||||||||||||||||||||||||||||||||||||||
Table 1.
The evolution fractions of several basic Si-centered clusters in amorphous alloy Pd82Si18 from 810 to 300 K.
Pd82Si18合金从810 到300 K的几种基本Si原子为中心的团簇的演化分数

Set citation alerts for the article
Please enter your email address
© Copyright 2018-2021 | Chinese Laser Press. All Rights Reserved 沪ICP备15018463号-20