• High Power Laser Science and Engineering
  • Vol. 11, Issue 1, 01000e12 (2023)
Desheng Zhao1、2、3, Bin Zhang1、2、3、*, Xiran Zhu1、2、3, Shuailin Liu1、2、3, Li Jiang1、2、3, Zhiyuan Dou1、2、3, Linyong Yang1、2、3, and Jing Hou1、2、3、*
Author Affiliations
  • 1College of Advanced Interdisciplinary Studies, National University of Defense Technology, Changsha, China
  • 2Nanhu Laser Laboratory, National University of Defense Technology, Changsha, China
  • 3Hunan Provincial Key Laboratory of High Energy Laser Technology, Changsha, China
  • show less
    DOI: 10.1017/hpl.2023.3 Cite this Article Set citation alerts
    Desheng Zhao, Bin Zhang, Xiran Zhu, Shuailin Liu, Li Jiang, Zhiyuan Dou, Linyong Yang, Jing Hou. 2.1 μm, high-energy dissipative soliton resonance from a holmium-doped fiber laser system[J]. High Power Laser Science and Engineering, 2023, 11(1): 01000e12 Copy Citation Text show less
    Experimental setup of the holmium-doped mode-locked seed laser.
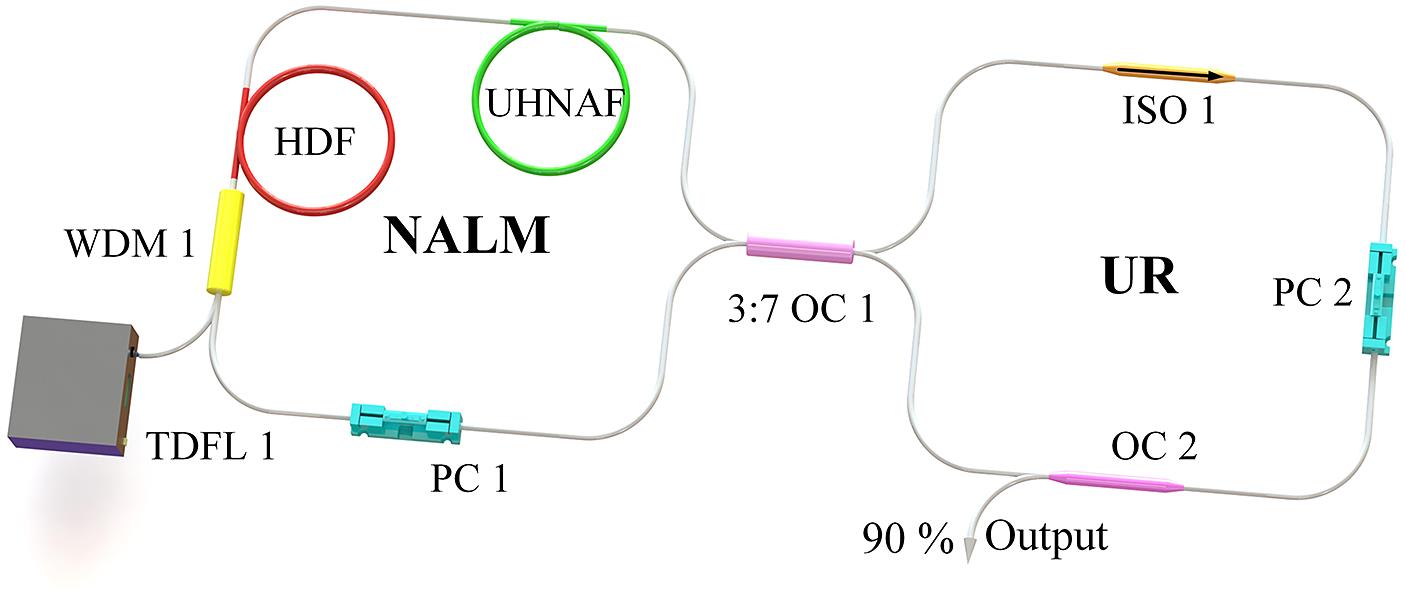
    Fig. 1. Experimental setup of the holmium-doped mode-locked seed laser.
    Schematic of the MOPA system.
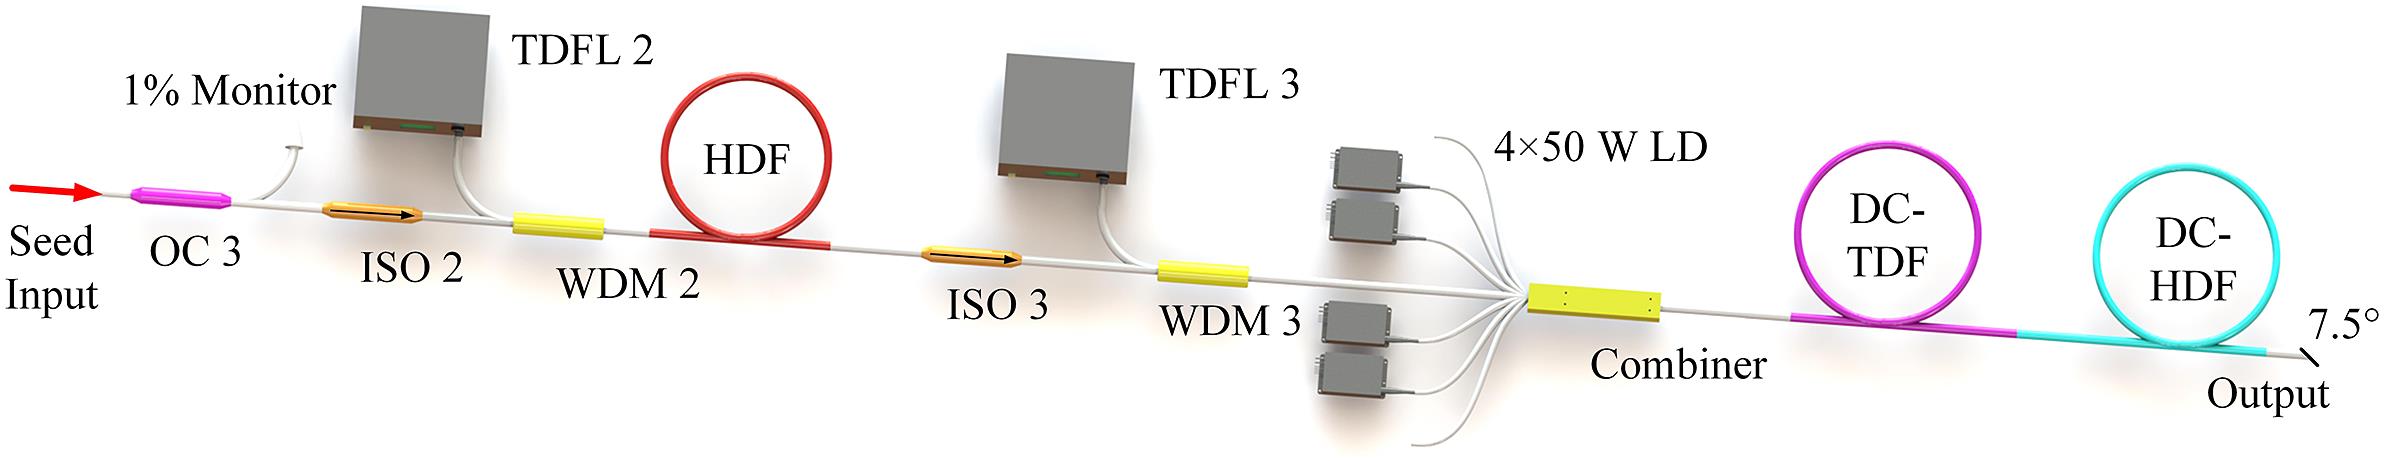
    Fig. 2. Schematic of the MOPA system.
    (a) The evolution of the optical spectrum with TDFL 1 power. (b) The waveforms under different TDFL 1 power levels. Inset: the pulse width dependence on TDFL 1 power.
    Fig. 3. (a) The evolution of the optical spectrum with TDFL 1 power. (b) The waveforms under different TDFL 1 power levels. Inset: the pulse width dependence on TDFL 1 power.
    Mode-locked pulse properties. (a) Pulse sequence within approximately 4 μs. (b) Autocorrelation trace with 50 ps scan range. RF spectra measured at approximately (c) 2 MHz and (d) 400 MHz.
    Fig. 4. Mode-locked pulse properties. (a) Pulse sequence within approximately 4 μs. (b) Autocorrelation trace with 50 ps scan range. RF spectra measured at approximately (c) 2 MHz and (d) 400 MHz.
    (a) Output power and pulse energy versus TDFL 1 power. (b) Conversion efficiency versus TDFL 1 power.
    Fig. 5. (a) Output power and pulse energy versus TDFL 1 power. (b) Conversion efficiency versus TDFL 1 power.
    (a) Output spectra of mode-locked pulses under different HDF lengths. (b) Center wavelength and output power versus HDF length.
    Fig. 6. (a) Output spectra of mode-locked pulses under different HDF lengths. (b) Center wavelength and output power versus HDF length.
    (a) Variations of output power and pulse energy of a seed laser with UHNAF length. (b) Variation of output power with increasing TDFL 1 power under different output coupling ratios (k).
    Fig. 7. (a) Variations of output power and pulse energy of a seed laser with UHNAF length. (b) Variation of output power with increasing TDFL 1 power under different output coupling ratios (k).
    (a) Evolutions of output power and pulse energy as a function of TDFL 2 power. (b) Optical spectrum and waveform at the maximum power of TDFL 2.
    Fig. 8. (a) Evolutions of output power and pulse energy as a function of TDFL 2 power. (b) Optical spectrum and waveform at the maximum power of TDFL 2.
    (a) Optical spectra versus output power. (b) Pulse envelope at maximum output power. Inset: pulse train at approximately 80 μs. (c) The RF spectrum captured under output power of 54.4 W. Inset: RF spectrum at approximately 400 MHz.
    Fig. 9. (a) Optical spectra versus output power. (b) Pulse envelope at maximum output power. Inset: pulse train at approximately 80 μs. (c) The RF spectrum captured under output power of 54.4 W. Inset: RF spectrum at approximately 400 MHz.
    (a) Output power and pulse energy with increasing 793 nm pump power. (b) Optical spectra in logarithmic and linear coordinates with spectrum resolution of 0.05 nm at output power of 54.4 W.
    Fig. 10. (a) Output power and pulse energy with increasing 793 nm pump power. (b) Optical spectra in logarithmic and linear coordinates with spectrum resolution of 0.05 nm at output power of 54.4 W.
    Measured power fluctuation over 1 hour under average output power of 45.4 W.
    Fig. 11. Measured power fluctuation over 1 hour under average output power of 45.4 W.
    Center wavelength (nm)Output power (W)Pulse energy (nJ)Conversion efficiency (%)Reference
    2024.20.01565.80.39[23]
    2050.3730.018912.40.39[38]
    2045.30.038326.50.98[25]
    20760.0179420.85[24]
    2103.70.23388.14.57This work
    Table 1. Summary of holmium-doped mode-locked DSR fiber lasers.
    System configurationPulse typeOutput power (W)Pulse energy (μJ)Reference
    SESAM a + single-stage amplifierCS2.080.076[39]
    NPR + single-stage amplifierCS~0.20.007[40]
    Hybrid mode-locking + single-stage amplifierCS0.40.02[3]
    NALM + single-stage amplifierNLP5.81.52[37]
    NALM + dual-stage amplifiersDSR50.419.1This work
    Table 2. Performance comparison of holmium-doped mode-locked fiber laser systems.
    Desheng Zhao, Bin Zhang, Xiran Zhu, Shuailin Liu, Li Jiang, Zhiyuan Dou, Linyong Yang, Jing Hou. 2.1 μm, high-energy dissipative soliton resonance from a holmium-doped fiber laser system[J]. High Power Laser Science and Engineering, 2023, 11(1): 01000e12
    Download Citation